Posted on 4 June 2025
Cost of Goods Sold Template Excel & Google Sheets
- The COGS template is available in Excel and Google Sheets.
- It calculates your cost of goods sold using FIFO, LIFO, and Weighted Average methods—on one simple sheet.
- Reveals your ending inventory value and average cost per unit so you can monitor profit margins with confidence.
- Enables informed decisions on pricing, purchasing, and inventory strategy by comparing accounting methods side by side.


What is Cost of Goods Sold (COGS)?
Cost of Goods Sold (COGS) is the total direct cost of producing or purchasing the goods a business sells in a given period. It includes raw materials, direct labor, and manufacturing overhead, but excludes indirect costs like marketing or admin.
The formula: COGS = Beginning Inventory + Purchases During the Period − Ending Inventory
This free template calculates your COGS automatically using FIFO, LIFO, and Weighted Average methods, so you can compare accounting approaches and make informed pricing and inventory decisions.
Stop calculating manually and let your accounting software track COGS automatically. Try Enerpize free.
What is The Cost of Goods Sold Template?
A Cost of Goods Sold (COGS) template is used to calculate the total direct costs associated with producing or acquiring the goods a business sells within a specific period. This includes expenses such as raw materials, direct labor, and manufacturing overhead directly tied to production. It excludes indirect costs, such as marketing, administrative salaries, and distribution.
The template follows this standardized COGS formula:
COGS = Beginning Inventory + Purchases During the Period – Ending Inventory
This provides businesses with a precise figure that reflects the actual cost of goods sold, which is essential for determining gross profit and gross margin.
By using a COGS template, companies can facilitate their accounting processes, ensure consistency in financial reporting, and maintain accurate records for tax and strategic planning purposes. Whether you're a manufacturer, retailer, or e-commerce seller, a well-constructed cost of goods sold template offers clarity into your cost structure and supports data-driven decision-making.
You may also like: Online COGS Calculator
What Does a Cost of Goods Sold Template Contain?
1- Production and Sales Data:
This sets the stage for your COGS analysis. These two inputs determine how inventory is allocated and which units are accounted for as sold versus remaining in inventory.
- Units of Goods Produced
- Units of Goods Sold
2- Unit Cost Details:
- Unit Cost for the First Produced Units
- Unit Cost for the Last Produced Units
These fields represent cost fluctuations within your production cycle, whether due to supply chain volatility, vendor pricing, or batch manufacturing differences. Tracking these differences is essential for methods like FIFO and LIFO, which rely on the chronological order of production.
3- Inventory Summary
- Total Inventory Cost
This is a foundational metric and is simply the sum of all produced units multiplied by their respective unit costs. It represents the total value of inventory before any sales.
4- Cost of Goods Sold (COGS) Calculations by Method
This is the heart of the cost of goods sold template. It compares COGS under:
- FIFO (First-In-First-Out): Assumes that older inventory is sold first. COGS reflects earlier, possibly cheaper costs.
- LIFO (Last-In-First-Out): Assumes the most recent (and possibly more expensive) inventory is sold first. COGS reflects later costs.
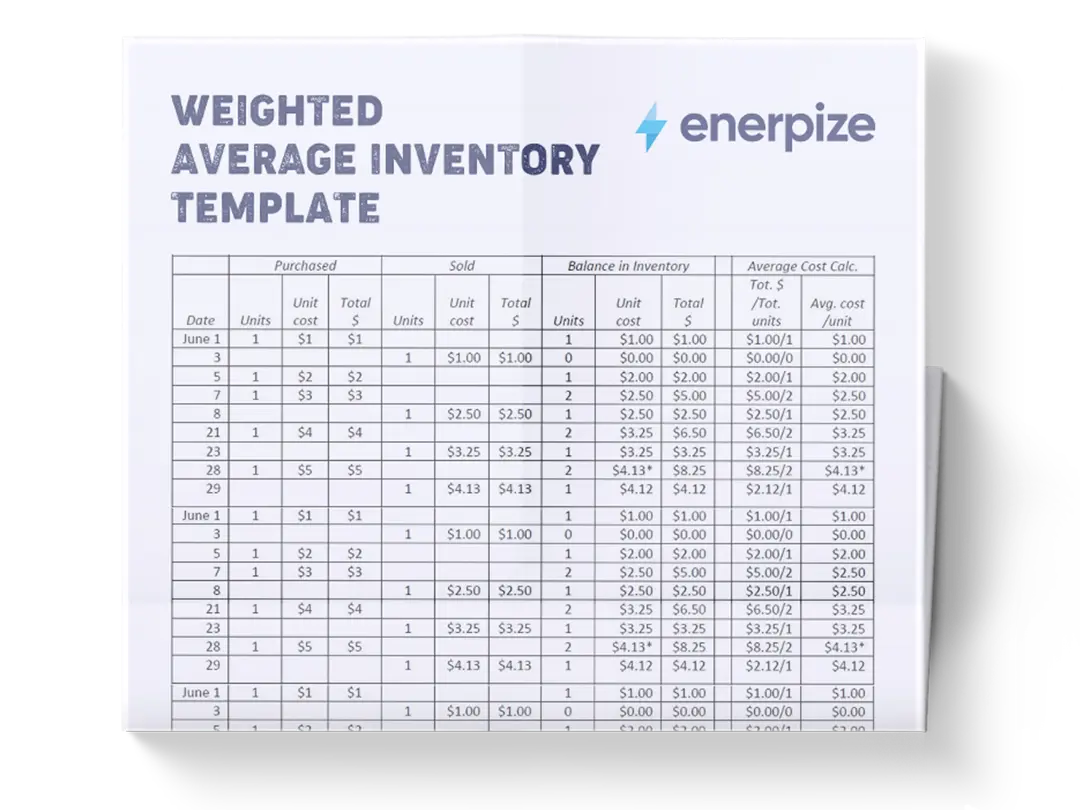
- Weighted Average Cost: Averages the cost of all produced units to apply a uniform rate to sold units.
Each method results in a different COGS figure, which has tax and profit implications depending on your market environment.
5- Ending Inventory
For each method, the cost of goods sold Excel template automatically calculates the remaining inventory value based on which units were sold and at what cost. This helps ensure accurate balance sheet reporting.
6- Average Unit Cost
This value is derived for each method and reflects the average cost applied to inventory on hand. It informs both future pricing decisions and margin analysis.
7- Unit Cost Breakdown by Method
The final row highlights the unit cost per method, giving you visibility into how each inventory method affects the cost structure.
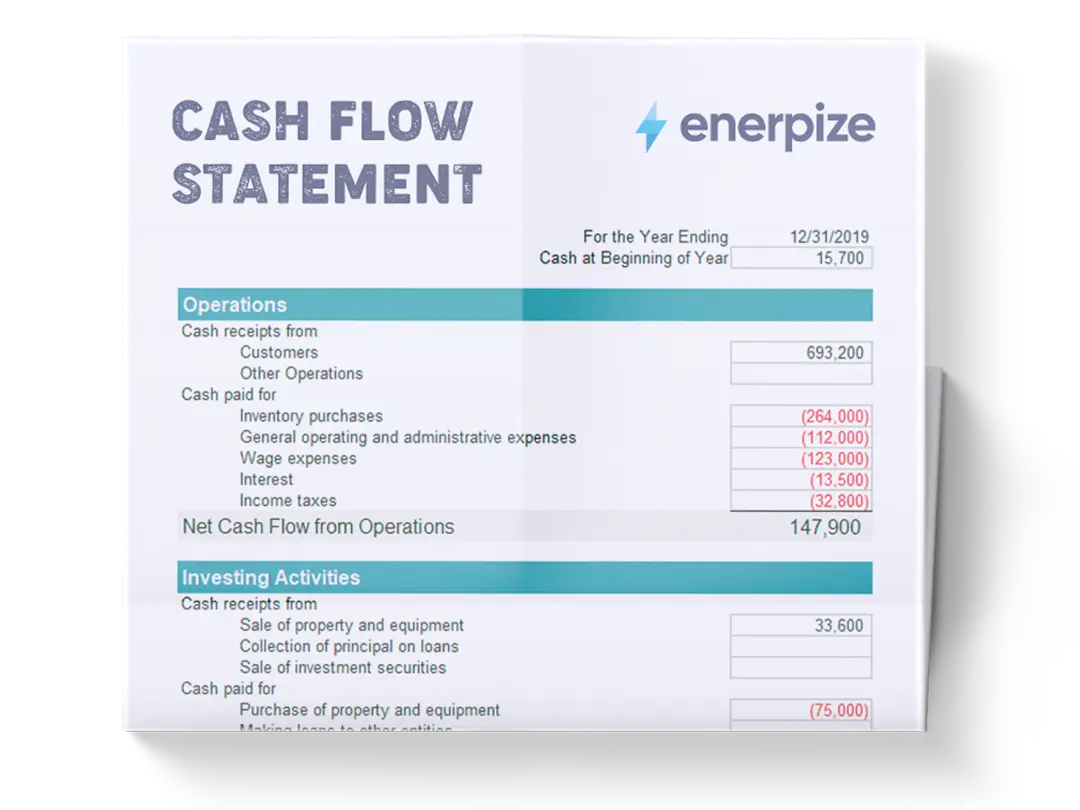
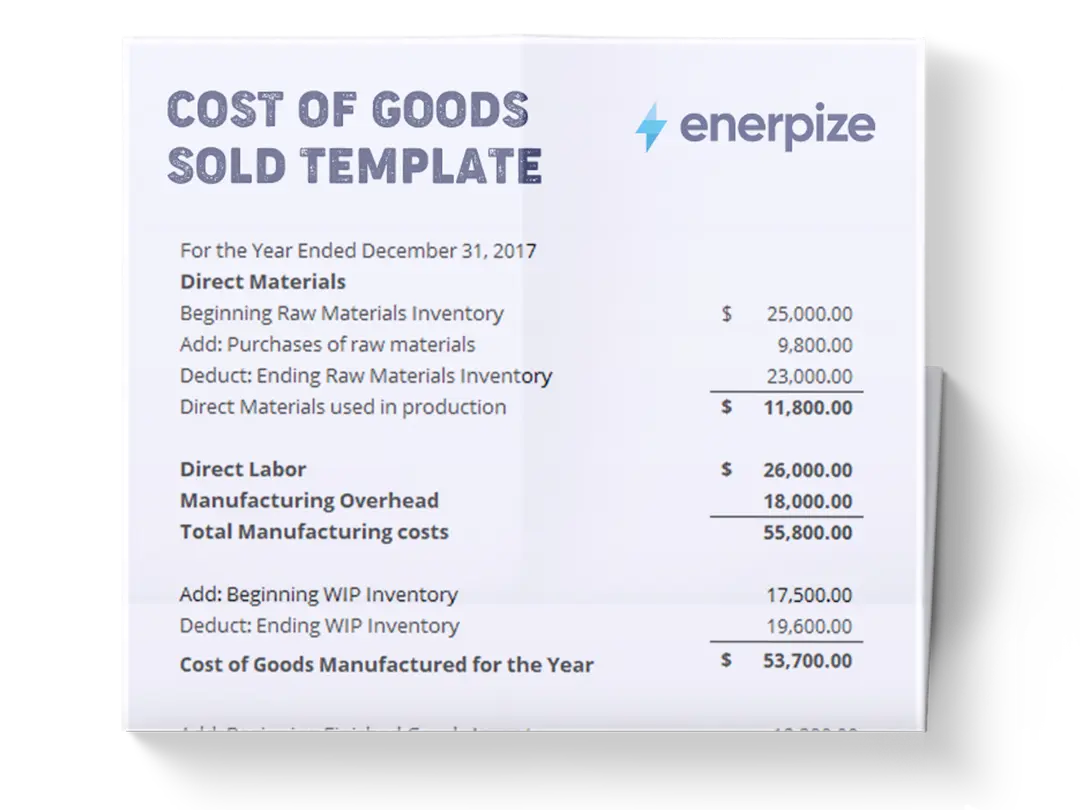
What Is a Cost of Goods Sold Statement?
A cost of goods sold statement is a formal financial document that breaks down the total cost of goods sold during an accounting period in more detail than a standard income statement provides. While the income statement shows COGS as a single line item, the COGS statement expands it into its component parts: beginning inventory, raw materials used, direct labor, manufacturing overhead, and ending inventory.
It follows this structure:
Beginning Inventory + Purchases − Ending Inventory = Cost of Goods Sold
Manufacturers use it most frequently because their cost structure is more complex than a retailer's. A retailer can often calculate COGS directly from purchase invoices. A manufacturer needs to account for materials consumed, labor applied, and overhead absorbed before arriving at the final figure.
How is it different from this template?
This COGS template is a calculation tool, not a formal statement. You use it to work out your COGS figure under different inventory methods (FIFO, LIFO, Weighted Average). Once you have that figure, it feeds into your cost of goods sold statement, which then feeds into your income statement. Think of the template as the engine and the statement as the report it powers.
If you are using accounting software like Enerpize, your COGS statement is generated automatically from your inventory and purchase records, eliminating the need to build it manually.
How to Use the Cost of Goods Sold Template
1- Gather Your Inventory and Cost Data
Before touching the COGS Excel template:
- Determine Production Volumes: Count how many units were produced in the relevant period.
- Track Sales: Know how many units were sold within the same time frame.
- Record Unit Costs: Capture the cost for each unit batch. This might differ across time due to supplier price changes, manufacturing conditions, or raw material costs.
Tip: Always base unit cost on actual, documented data (invoices, production sheets, etc.)—don’t estimate. Precision here drives the validity of your COGS.
2- Input Production and Sales Figures
- Total units produced
- Units sold
This dataset sets the inventory flow foundation for the FIFO and LIFO calculations. Without these figures, the COGS template can’t generate accurate output.
3- Enter Unit Costs
- Cost of the first batch of units produced
- Cost of the last batch of units
For example, if you produced 4 units: the first 3 at $5, and the last at $10—enter accordingly. These values are what drive the differences in COGS across methods.
4- Review Automatically Calculated Totals
Once inputs are entered, the cost of goods sold Excel template calculates:
- Total Inventory Cost: The Total cost of all produced units.
- COGS by Method: FIFO, LIFO, Weighted Average
- Ending Inventory by Method: How much value is left in inventory, depending on the method
- Average Unit Cost per Method: Average cost used to value the remaining inventory
Each output updates dynamically and lets you understand the accounting implications of your chosen method.
5- Compare COGS Across Methods
This is where strategic insight happens. Review the difference in COGS:
- Higher COGS (LIFO) typically lowers profit (and taxes)
- Lower COGS (FIFO) inflates profit margins, potentially improving valuations
- Weighted Average smooths fluctuations for consistent reporting
Tip: Use this section to simulate what-if scenarios. For instance, what happens to your profitability if supplier prices increase and you apply FIFO vs. LIFO?
6- Interpret Ending Inventory Values
Ending inventory affects the balance sheet and overall asset value.
- If you use FIFO and costs are rising, you’ll report higher asset values.
- If you use LIFO, the remaining inventory is valued using older, cheaper costs.
Understand the impact this has on:
- Financial statements
- Valuation reports
- Lender negotiations
- Investor relations
7- Use Outputs to Inform Strategic Decisions
Once the numbers are in front of you:
- Forecast Margins: How will different costing methods affect your gross margin?
- Evaluate Tax Strategy: In high-inflation periods, LIFO may reduce taxable income.
- Plan Purchasing: If the cost per unit is rising, buying in bulk under FIFO may protect margins.
Also, consider consistency—frequent method changes may raise red flags in audits or financial reviews. Choose the method that aligns with your long-term strategy and stick to it unless materially justified.
8- Download and Maintain Your Records
- Save a copy of the filled-out template
- Maintain a digital record for audit trails
- If you’re using accounting software, you can use this template to cross-check software calculations for accuracy
Ready to track COGS automatically? Start your free Enerpize account — no credit card needed.
Importance of Cost of Goods Sold Template
Determines Gross Profit and Margins Accurately
A COGS template ensures that businesses calculate gross profit with precision by subtracting only the direct costs of production from total revenue. This allows for an accurate assessment of profitability per unit and overall product lines. Understanding these metrics empowers businesses to make informed decisions about pricing, cost control, and resource allocation.
Supports Strategic Pricing Decisions
With a clear view of production costs, businesses can set competitive yet profitable price points. A COGS template enables dynamic pricing strategies by highlighting how fluctuations in material or labor costs affect margins. This insight is crucial for maintaining profitability while adapting to market conditions.
Enhances Inventory Management Efficiency
The COGS template in Google Sheets accounts for both beginning and ending inventory levels, enabling businesses to track stock turnover and identify slow-moving or obsolete inventory. This leads to better purchasing decisions, reduced carrying costs, and improved cash flow management.
Reduces Tax Liability Through Deductions
Under IRS guidelines, COGS is a fully deductible expense, lowering taxable income. A well-documented COGS template ensures compliance and maximizes deductions during tax season. It also simplifies audit preparation by providing a centralized record of eligible production-related expenses.
Provides Insight Into Operational Performance
Tracking COGS over time reveals trends in production efficiency, supplier performance, and cost management. This data helps leadership identify inefficiencies, renegotiate contracts, and optimize workflows to improve the bottom line.
Who Can Use the Cost of Goods Sold Template?
Manufacturers and Product-Based Businesses
Companies that produce physical goods—whether custom-made or mass-produced—rely on COGS templates to account for raw materials, labor, and overhead. These businesses benefit from granular visibility into production costs, enabling them to refine operations and increase margins.
Retailers and E-commerce Sellers
Retailers who purchase finished goods for resale can use a COGS template to include acquisition costs such as wholesale prices, freight-in charges, customs duties, and handling fees. For online sellers, especially those managing multi-channel inventory.
Startups and Small Businesses
Early-stage companies often lack accounting systems. A COGS template offers a simple yet effective way to understand core costs, set realistic pricing, and project financial performance. It also lays the foundation for scalable financial practices as the business grows.
Service-Based Businesses with Tangible Deliverables
While service-based industries typically don’t carry high inventory, some, like print shops, consulting firms with deliverables, or SaaS providers with hardware components, can still apply a modified COGS template to track direct costs related to client deliverables.
Businesses Seeking Investment or Financing
Investors and lenders evaluate gross margins to assess financial health and growth potential. A well-maintained COGS template provides transparency into cost structures, making it easier to present a compelling financial narrative to stakeholders.
FAQs
What is a Cost of Goods Sold (COGS) template?
A Cost of Goods Sold template is a pre-built spreadsheet that calculates the total direct costs of producing or purchasing the goods your business sells in a given period. It automates the COGS formula — Beginning Inventory + Purchases − Ending Inventory = COGS — and compares results across FIFO, LIFO, and Weighted Average inventory methods so you can understand the accounting and tax implications of each approach without building the formulas yourself.
What is the COGS formula?
The standard COGS formula is: Beginning Inventory + Purchases During the Period − Ending Inventory = Cost of Goods Sold. Beginning inventory is what you had on hand at the start of the period. Purchases include all direct acquisition costs such as supplier invoices, freight-in, and import duties. Ending inventory is the value of unsold stock remaining at the end of the period. The result is the cost of goods that were actually sold.
What is the difference between FIFO, LIFO, and Weighted Average?
FIFO (First-In, First-Out) assumes the oldest inventory is sold first, resulting in lower COGS and higher reported profit when costs are rising. LIFO (Last-In, First-Out) assumes the newest inventory is sold first, resulting in higher COGS and lower taxable income in inflationary periods. Weighted Average applies a uniform cost across all units by averaging total inventory cost over total units produced. Each method produces a different COGS figure, which affects gross profit, tax liability, and ending inventory valuation on the balance sheet.
What is the difference between a COGS template and a cost of goods sold statement?
A COGS template is a calculation tool you use to work out your cost of goods sold figure, typically comparing FIFO, LIFO, and Weighted Average methods side by side. A cost of goods sold statement is a formal financial document that presents the full breakdown of production costs for an accounting period, including raw materials, direct labor, and manufacturing overhead, and is used for internal analysis or audit preparation. The template produces the number. The statement contextualizes it within your broader financials.
What is the cost of goods sold formula in Excel?
The COGS formula in Excel is =B2+C2-D2, where B2 is Beginning Inventory, C2 is Purchases During the Period, and D2 is Ending Inventory. The result in E2 is your COGS for the period. The formula itself stays the same across FIFO, LIFO, and Weighted Average — what changes is the ending inventory value you apply under each method. This template handles that calculation automatically, so you do not need to rebuild the formula for each method.
Is COGS the same as operating expenses?
No. COGS covers only the direct costs of producing or purchasing the goods you sell, such as raw materials, direct labor, and manufacturing overhead. Operating expenses (OPEX) are the broader costs of running your business, including salaries, rent, marketing, and utilities. On the income statement, COGS is subtracted from revenue to arrive at gross profit. Operating expenses are then subtracted from gross profit to arrive at operating income. Mixing the two overstates your COGS and understates your gross margin, which distorts every profitability metric downstream.
Who should use a COGS template?
Any business that sells physical goods benefits from a COGS template. This includes manufacturers tracking raw material and labor costs, retailers calculating acquisition and freight costs, e-commerce sellers managing multi-channel inventory, and startups establishing financial discipline early. Service businesses with tangible deliverables, such as print shops or hardware-inclusive SaaS providers, can also adapt the template to track direct delivery costs.
How does COGS affect gross profit?
Gross profit is calculated as Revenue minus COGS. The lower your COGS, the higher your gross profit and gross margin. This is why the inventory method you choose matters — FIFO in a rising-cost environment produces lower COGS and higher reported gross profit, while LIFO produces higher COGS and lower gross profit but also lower taxable income. Understanding this relationship is essential for pricing decisions, investor reporting, and tax planning.
Is COGS tax deductible?
Yes. Under IRS guidelines and most international tax frameworks, COGS is a fully deductible business expense. It reduces your taxable income directly, which is why businesses in high-inflation environments sometimes prefer LIFO — it raises COGS and lowers the tax bill. A well-documented COGS template supports this deduction by providing a clear, auditable record of all production-related costs for the period.
What is HPP in accounting?
HPP stands for Harga Pokok Penjualan, the Indonesian accounting term for Cost of Goods Sold. It represents the same concept: the total direct costs associated with producing or purchasing the goods a business sells in a given period. The formula is identical — Beginning Inventory + Purchases − Ending Inventory = HPP. This template can be used to calculate HPP for any business regardless of the accounting terminology used in your local market.
Enerpize calculates your cost of goods sold automatically — no templates, no manual formulas. Create your free account and see it live.
Related Templates
Free Excel Inventory Turnover Template
Project Cost Tracking Excel Template
Stock Valuation Template Excel