Posted on 10 August 2025
Dead Stock Report Excel & Google Sheets
- The dead stock report is available in Excel and Google Sheets.
- Identifies products with no recent activity to help reduce waste and free up storage space.
- Tracks the age and value of inventory to support smarter purchasing and replenishment.
- Offers a clear, structured overview that simplifies inventory audits and financial forecasting.


What is the Dead Stock Report?
The dead stock report identifies unsellable, stagnant inventory that has remained untouched for an extended period. Dead stock, also referred to as obsolete or excess inventory, represents items that were never sold to customers and are unlikely to be sold in the future due to being out of season, outdated, expired, or simply unwanted.
These consume valuable shelf and warehouse space, tie up working capital, and erode profitability by accumulating storage costs without generating revenue.
Unlike returns or slow-moving items, dead stock is typically inventory that has never left your possession. It’s important not to confuse this with the term “deadstock,” which collectors use to describe unworn, discontinued goods that may still have value. In the context of retail and inventory management, dead stock is a liability, and a dead stock report helps businesses spot and respond to this problem early, before it silently bleeds resources.
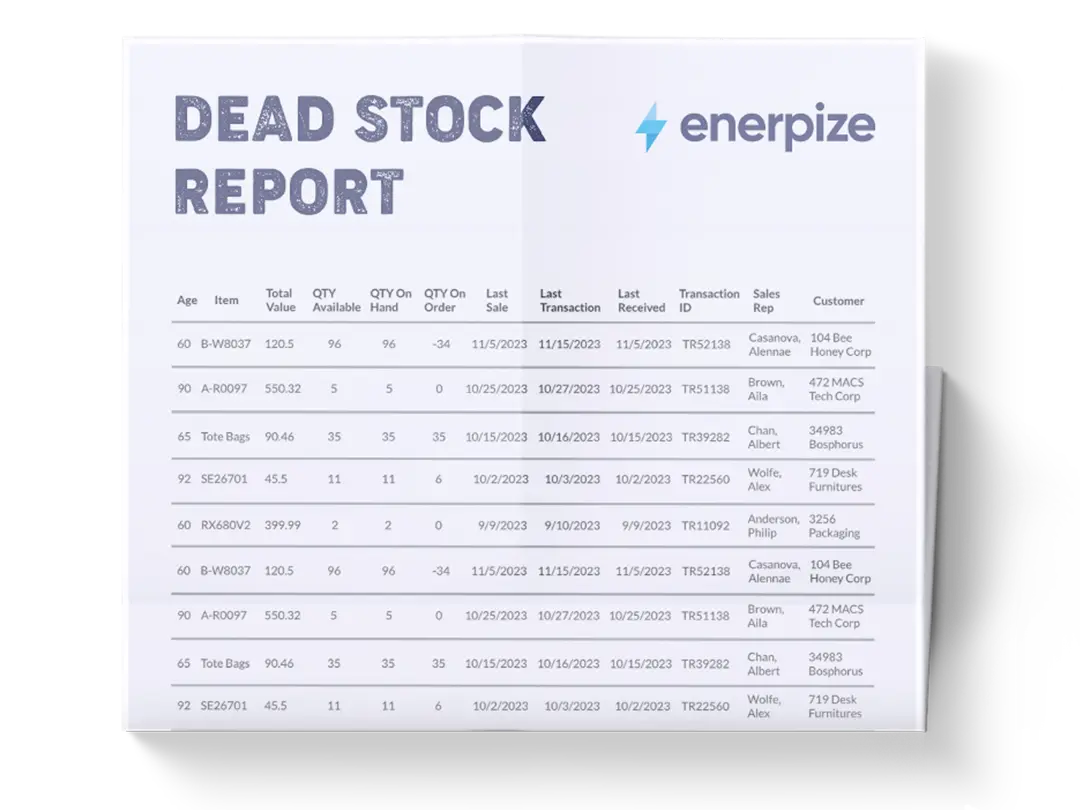
What Does the Dead Stock Report Contain?
Product and Variant:
These columns capture the specific item and its version (e.g., size, color, or model). This granularity allows you to pinpoint which particular SKUs are not performing, rather than generalizing at the category level.
Unit Cost:
This field shows the cost per unit of each variant. Understanding the value tied up in dead stock helps you quantify the financial impact of slow-moving or obsolete items, which directly affects your cash flow and profitability.
Last Order Date:
This tracks when each product variant was last ordered, serving as the primary indicator of product movement. The older the date, the stronger the signal that the item may be redundant.
Days from Last Order:
Automatically calculated, this column provides a dynamic age of inactivity. It's a practical benchmark for defining what qualifies as "dead stock" based on your business cycle (e.g., 90 days, 180 days).
Available Quantity (QTY):
Displays the current number of units in stock. This helps you estimate how much physical space is being consumed by non-performing inventory.
Total Inventory Value:
This column multiplies unit cost by available quantity to show the financial burden of holding onto dead stock. This is especially valuable for finance teams who want a bottom-line figure they can act on.
How to Use the Dead Stock Report?
1- Import or Enter Product Data:
Start by filling in your product catalog:
- List All SKUs and Variants: Include every item you currently stock, ensuring product names and variant descriptors are clearly labeled.
- Input Unit Costs: Use actual procurement prices to reflect your financial exposure accurately.
- Update Last Order Dates: Pull this data from your purchase history or inventory management system. If an item has never been ordered, label it accordingly.
2- Define Your Threshold:
Decide how many days of inactivity you consider "dead stock". Common cutoffs include 90, 180, or 365 days, depending on your industry.
3- Review Available Quantity and Total Value:
- Assess Volume of Stagnant Stock: Focus on high-quantity items that haven’t moved. These often take up the most space and tie up the most capital.
- Spot High-Value Dead Stock: Even small quantities can be expensive if the unit cost is high. Prioritize these for immediate action.
4- Filter and Sort for Actionable Insights:
- Sort by Days from Last Order: Surface the oldest items first to prioritize clean-up.
- Filter by Inventory Value: Zero in on dead stock that costs the most to hold.
- Tag Never-Ordered Items: These are immediate candidates for removal from your catalog or promotional liquidation.
5- Take Action Based on Your Findings
- Liquidate or Discount: Offer clearance sales to recover cash.
- Bundle Strategically: Pair dead stock with popular items to move it faster.
- Stop Reordering: If the data shows consistent stagnation, halt replenishment.
- Consider Donations: If applicable, donate obsolete stock for tax deductions.
6- Schedule Regular Reviews
- Monthly or Quarterly Audits: Integrate this Excel dead stock report into your inventory review cycle.
- Collaborate Cross-Functionally: Share insights with procurement, finance, and sales to align decisions.
Importance of the Dead Stock Report
Optimizes Inventory Space
It highlights products that are no longer contributing to revenue. By identifying these items, businesses can clear up shelf or storage space and make room for high-demand, faster-moving inventory. This leads to more efficient use of physical space and better overall inventory turnover.
Unlocks Tied-Up Capital
Dead stock isn’t just wasted space; it’s wasted money. The capital invested in these unsold items is locked until the products are sold, if ever. By pinpointing dead stock, businesses can make informed decisions to liquidate or repurpose it, freeing up funds for reinvestment in profitable stock or operations.
Improves Cash Flow and Reduces Waste
Holding on to dead stock inflates storage costs, clogs operations, and hampers cash flow. A regular review using the dead stock Report helps eliminate this friction. Acting on the report reduces unnecessary holding costs and prevents excess buildup of non-performing inventory.
Informs Smarter Purchasing Decisions
The template doesn’t just diagnose current problems—it prevents future ones. Over-ordering is a major cause of dead stock, and reviewing historical trends in the dead stock report template helps refine forecasting and demand planning. This translates to better alignment between procurement and actual customer behavior.
Who Can Use the Dead Stock Report?
Retailers and E-Commerce Businesses
Any business managing physical products can use this template to maintain lean, profitable inventory. Retailers can quickly identify seasonal items that are no longer viable and take action before they become total losses.
Warehouse and Inventory Managers
Operations teams benefit directly from this dead stock Excel report by gaining visibility into slow-moving or immobile stock. It enables proactive clearance strategies, prevents overcrowding, and supports inventory optimization across multiple SKUs and storage locations.
Procurement and Buying Teams
Buyers can use the insights from dead stock analysis to adjust order volumes, change supplier agreements, or switch up product lines. This prevents repeated mistakes and ensures purchasing aligns with actual sales velocity and market demand.