Posted on 15 May 2025
Contribution Margin Income Statement Template Excel & Google Sheets
- The contribution margin income statement template is available in Excel and Google Sheets.
- Reveal your true contribution margin by separating variable and fixed costs for clearer financial insights.
- It's used to calculate breakeven points, evaluate product performance, and support pricing strategies with precision.
- Delivers a clear picture of unit-level profitability, helping you identify high-margin products, optimize cost structures, and plan for sustainable growth.


What is The Contribution Margin Income Statement Template?
A contribution margin income statement template is a powerful financial tool designed to help businesses evaluate profitability by distinguishing between variable and fixed costs.
Unlike the traditional income statement, which organizes expenses by function (such as cost of goods sold or operating expenses), the contribution margin format separates costs based on their behavior—whether they change with the level of output (variable) or remain constant regardless of production volume (fixed). This provides deeper insight into the cost structure of a business and supports better decision-making around pricing, product mix, and cost control.
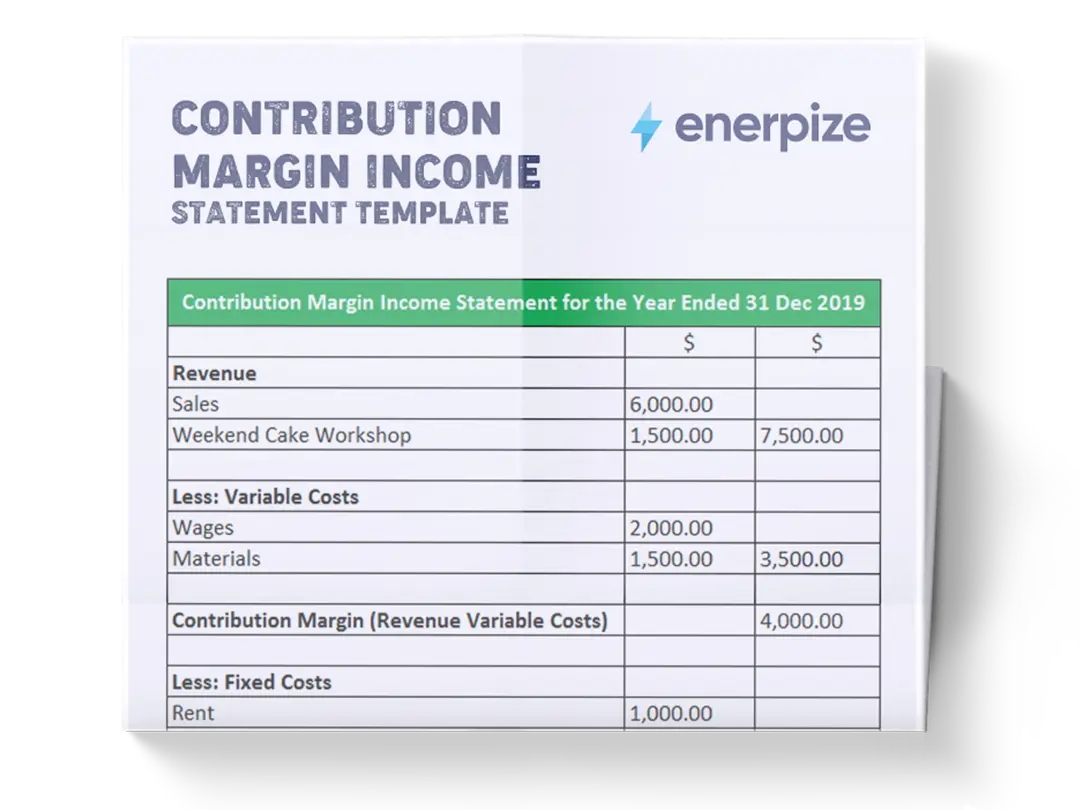
What Does a Contribution Margin Income Statement Template Contain?
1- Revenue (Sales):
The total amount of money earned from the sale of goods or services during a specific time period. Revenue serves as the starting point for the income statement and represents the top-line value before any costs are deducted.
2- Cost of Goods Sold (COGS):
While some templates may include COGS as part of variable costs, in many cases, it is broken down separately. However, in a contribution margin context, only the variable portion of COGS is considered. This might include direct materials, direct labor, and other production-related costs that fluctuate with output.
3- Variable Operating Expenses:
These are non-manufacturing costs that vary directly with the level of activity. like marketing expenses, shipping fees, commissions, and packaging costs. These expenses increase or decrease depending on how much is sold or produced.
4- Total Variable Costs:
This is the sum of all variable expenses, including both variable COGS and variable operating expenses. It reflects the total cost incurred that changes with production or sales volume.
5- Contribution Margin ($):
This shows how much money is left after subtracting variable costs from revenue. It indicates the amount available to cover fixed costs and generate profit.
6- Contribution Margin (%) or Ratio:
This expresses the contribution margin relative to revenue, showing the proportion of each sales dollar that contributes to covering fixed costs and generating profit.
7- Fixed Costs:
These are expenses that remain constant regardless of the level of production or sales. Examples include rent, salaries, insurance, depreciation, and administrative overhead.
8- Units of Goods Sold:
This field records the number of units sold during the reporting period. It is essential for calculating unit-level profitability metrics such as contribution margin per unit and break-even point.
9- Contribution Margin per Unit:
This metric reveals how much each unit contributes to covering fixed costs and generating profit. It helps businesses assess the profitability of specific products or services.
10- Break-Even Point (Units):
This is the minimum number of units a company must sell to cover all its fixed and variable costs. At this point, the business makes no profit but also incurs no loss.
Related Templates:
Free Break-Even Analysis Template
Free Income Statement Template
How to Use the Contribution Margin Income Statement Template
1- Gather Accurate Financial Data
Before filling out the contribution margin income statement template, collect all relevant financial information for the reporting period. This includes:
- Revenue figures: Sales reports, invoices, and payment records.
- Variable costs: Direct materials, direct labor, commissions, delivery fees, etc.
- Fixed costs: Rent, salaries, utilities, insurance, and other overheads.
- Ensure that all data is categorized correctly—separating variable from fixed costs is crucial for the accuracy of your contribution margin calculation.
2- Enter Revenue and Cost Figures
Use the contribution margin income statement Excel template’s designated fields to input your actual financial data:
- Revenue: Enter the total sales generated during the period.
- Variable Costs: Input each category of variable expense, such as:
- Cost of Goods Sold (if variable-based)
- Marketing Expense
- Delivery/Packaging Fees
- Fixed Costs: List all fixed overheads like rent, insurance, salaries, etc.
3- Review and Verify Calculations
Once all entries are made, verify the automatic calculations performed by the template:
- Ensure that Total Variable Costs equals the sum of all variable expenses.
- Confirm that Contribution Margin is calculated correctly (Revenue – Total Variable Costs).
- Check that the Contribution Margin % is accurate and expressed as a percentage of revenue.
- Validate the Contribution Margin per Unit and Break-Even Point using the formulas provided.
- If discrepancies arise, revisit your inputs and correct any errors immediately.
4- Interpret the Results and Take Action
With the completed Excel contribution margin income statement, you now have valuable insights into your business’s financial health:
- Analyze Contribution Margin: Understand how much of your revenue is contributing to covering fixed costs and generating profit.
- Assess Product Performance: If you run multiple product lines, compare their respective contribution margins to identify high-performing offerings.
- Evaluate Pricing Strategy: If the contribution margin is low, consider adjusting your pricing or reducing variable costs.
- Plan for Growth: Use the break-even point to determine how many additional units you need to sell to achieve desired profit targets.
5- Update and Maintain the Template Regularly
To get the most out of your template, treat it as a dynamic financial tool rather than a one-time report:
- Update Monthly or Quarterly: Keep the template current by updating it regularly with fresh financial data.
- Track Trends Over Time: Monitor how your contribution margin, fixed costs, and break-even point evolve over several periods.
- Archive Older Versions: Maintain a history of past templates for trend analysis and comparative benchmarking.
Importance of Contribution Margin Income Statement Template
Enables Precise Profitability Analysis
The contribution margin format allows businesses to analyze profitability at a granular level by distinguishing between variable and fixed costs to determine the exact contribution of each product, service, or business segment to overall profitability.
Supports Break-Even and Cost-Volume-Profit (CVP) Analysis
With the contribution margin clearly identified, businesses can calculate their break-even point, the level of sales needed to cover all fixed and variable costs without generating profit. CVP analysis also becomes more straightforward, enabling your company to forecast profits at different levels of output and assess the impact of price changes or cost fluctuations.
Boosts Strategic Pricing and Product Decisions
Your management will be empowered to make informed pricing decisions by understanding the per-unit contribution margin. If a product’s contribution margin is insufficient to cover fixed costs or support desired profit margins, you can consider re-pricing, reducing variable costs, or even exiting the market entirely.
Improves Cost Control and Operational Efficiency
Because variable and fixed costs are separated, it makes it easier to identify areas where costs can be reduced or optimized. Management can monitor trends in variable costs relative to sales volume and take corrective action if inefficiencies arise, improving overall operational performance.
Who Can Use the Contribution Margin Income Statement Template?
Managers and Business Unit Leaders
Managers across departments—from operations to marketing—use the contribution margin income statement to assess the financial impact of their decisions. They can use it to evaluate the feasibility of a new product line, assess the profitability of a customer segment, or decide whether to increase production.
Cost Accountants and Financial Analysts
They all rely on the contribution margin income statement to conduct internal financial analyses, prepare forecasts, and model various business scenarios. It serves as a foundation for budgeting, variance analysis, and performance measurement, especially when comparing actual results against projections.
Strategic Decision-Makers and Executives
Senior leaders use this format to guide high-level strategic initiatives such as entering new markets, discontinuing underperforming products, or restructuring operations. The ability to quickly understand how changes in cost structure or sales mix affect profitability is critical for long-term growth and sustainability planning.
Sales and Marketing Teams
Sales and marketing teams benefit from understanding the contribution margin of the products they sell or promote. This knowledge helps them prioritize offerings with higher margins, tailor pricing strategies, and align incentives with company-wide profitability goals.