Posted on 6 August 2025
ABC Analysis Template Excel & Google Sheets
- The ABC analysis template is available in Excel and Google Sheets.
- Identify your top-performing products (Class A) that contribute significantly to revenue and focus resources on managing them effectively.
- Use the ABC analysis to reduce holding costs by allocating more attention to high-value items while minimizing stock levels for low-value items (Class C).
- Leverage detailed insights from the template to make informed decisions about purchasing, pricing, and marketing strategies.


What is the ABC Analysis template?
The ABC analysis template categorizes stock-keeping units (SKUs) based on their relative importance to the business, typically measured by sales revenue, profitability, or usage frequency. Rooted in the Pareto Principle (the 80/20 rule).
The analysis assumes that a small percentage of items account for the majority of value:
- Class A items contribute most significantly to revenue or cost savings and therefore require tight controls and frequent review.
- Class B items offer moderate value and demand occasional attention.
- Class C items contribute the least and should be managed with minimal resources.
The ABC analysis Excel template enables inventory managers to assign each item to one of these categories using historical sales, cost, and demand data, providing a structured, data-driven approach to decision-making. This technique is distinct from activity-based costing in accounting but shares the core principle of prioritizing based on impact.
What Does the ABC Analysis Template Contain?
Business Information Section
Business Name, Address, Phone, Email: Accurate business details ensure that all reports and analyses are correctly attributed and easily retrievable.
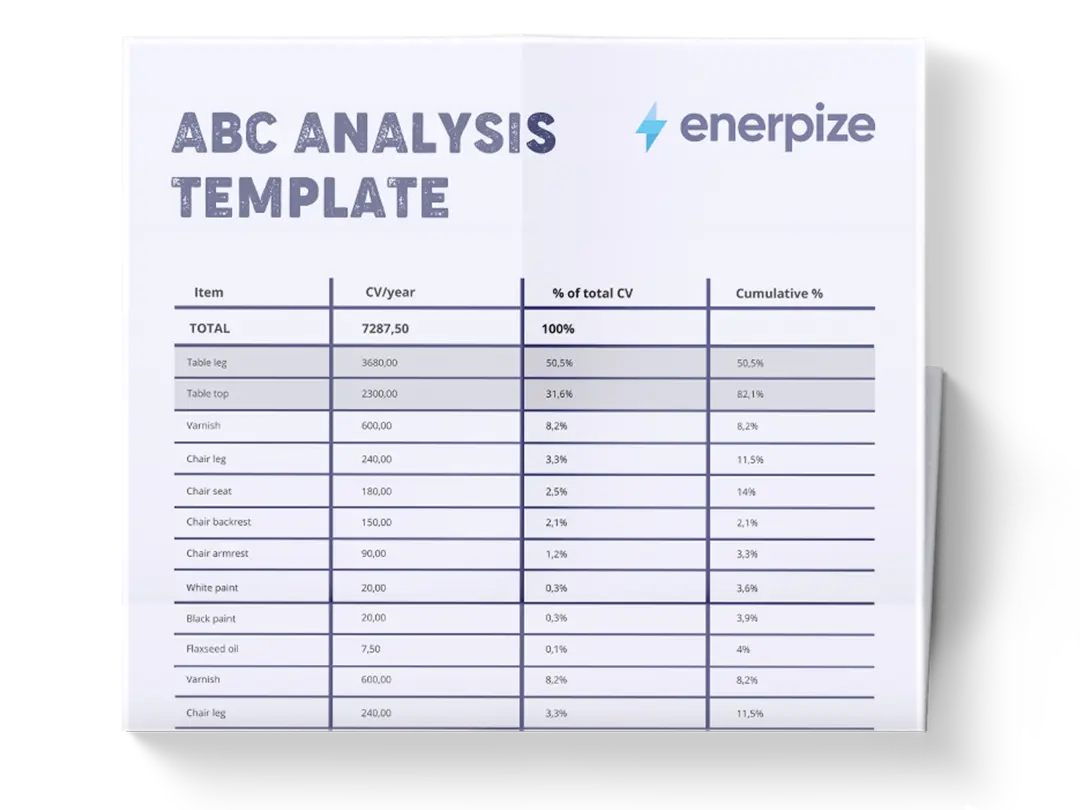
Product Data Table
- Products Column: Lists all the products in your inventory.
- 3 Months Sales Column: Records the total sales revenue generated by each product over the past three months. This timeframe provides a recent snapshot of product performance.
- Cumulative Quota Column: Calculates the cumulative percentage of total sales contributed by each product. This helps determine which products fall into Class A, B, or C.
- Class Column: Automatically assigns each product to one of three categories, Class A,B, and C
- Color-Coded Rows: The ABC analysis template uses color coding to visually distinguish between product classes:
- Yellow (Class A): Indicates high-value products requiring close monitoring.
- Red (Class B): Represents moderate-value products that require regular attention.
- Green (Class C): Highlights low-value products where inventory levels can be reduced or managed less intensively.
Summary Statistics
Class Summary Table: Provides an overview of the number of products, percentage of total products, and total sales for each class.
- # of Products: Shows how many products belong to each class.
- % of Products: Displays the proportion of total products in each class.
- Total Sales: Indicates the combined sales revenue generated by products in each class.
- Description: Explains the significance of each class (e.g., "Top 20% of sales" for Class A).
Pie Chart: A dynamic pie chart illustrates the distribution of sales across Classes A, B, and C. This visual representation makes it easier to grasp the relative importance of each product category at a glance.
How to Use the ABC Analysis Template
1- Prepare Your Product Data
Before using the ABC analysis Excel sheet, gather sales data for all products in your inventory. Ensure that the data covers the specified timeframe (e.g., the past three months).
Collect Sales Data :
- Obtain sales records from your accounting software, POS systems, or other relevant sources.
- Ensure that the data includes the product name and corresponding sales revenue for each item.
Organize the Data :
- Sort the products in descending order based on their sales revenue. This will help you identify high-performing products quickly.
2- Input Business Information
Enter your business details into the designated fields at the top of the template.
- Business Name: Enter the official name of your company.
- Business Address: Provide the full address for record-keeping purposes.
- Business Phone and Email: Include contact information for easy reference.
3- Populate the Product Data Table
Input the product names and their corresponding sales figures into the template. The ABC analysis Excel template will automatically calculate cumulative quotas and assign product classes based on the predefined criteria.
- Enter Product Names: List all products in the "Products" column. Ensure that each product is uniquely identified.
- Record Sales Revenue: In the "3 Months Sales" column, enter the total sales revenue generated by each product over the specified period.
- Review Cumulative Quotas: The template will automatically calculate the cumulative quota for each product. This column shows the percentage of total sales contributed by each product up to that point.
- Verify Class Assignments: The "Class" column will dynamically update to reflect whether each product belongs to Class A, B, or C. Review these assignments to ensure they align with your expectations.
4- Analyze the Results
Once the data is entered, the ABC analysis template will generate summary statistics and a pie chart visualization.
- Examine the Class Summary Table :
- Review the number of products, percentage of total products, and total sales for each class.
- Focus on Class A products, as they represent the highest-value items in your inventory.
- Interpret the Pie Chart :
- The pie chart provides a visual representation of the sales distribution across Classes A, B, and C. Use this to understand the relative importance of each product category.
- Identify Trends and Opportunities :
- Look for patterns in product performance. For example, are certain product lines consistently performing well, or are there outliers that require further investigation?
Related Templates
Inventory Valuation Report Sample
Small Business Inventory Spreadsheet Template
Importance of the ABC Analysis Template
Enhances Inventory Control
ABC analysis gives businesses a granular view of inventory performance, identifying top-performing products that deserve priority in stocking decisions. By focusing resources on Class A items, companies avoid overstocking low-demand products and minimize inventory waste.
Improves Forecasting and Demand Planning
Historical data on high-demand items allows managers to make informed predictions about future sales. This targeted forecasting leads to more accurate replenishment cycles, reducing both stockouts and overstock situations.
Optimizes Resource Allocation
Shelf space, staffing, and financial investment can all be strategically directed toward high-impact inventory. By reserving prime resources for Class A items, businesses maximize ROI and avoid inefficient use of storage or labor.
Reduces Storage and Holding Costs
Inventory carrying costs drop when businesses cut down on Class C items and refocus warehousing capacity on high-performing SKUs. This also opens up space for more profitable inventory.
Improves Cycle Counting Efficiency
Rather than counting everything, businesses can allocate more frequent checks to Class A items while reducing effort spent on low-impact products, improving accuracy without wasting resources.
Supports Lifecycle Management
Identifying where each product stands—launch, growth, maturity, or decline—becomes easier with ABC data. This insight enables timely adjustments in inventory strategy to match the product’s trajectory.
Enables Lean Operations and Process Simplification
By focusing attention on what matters most, businesses can eliminate waste, consolidate supply chains, and streamline workflows, resulting in faster, more responsive operations.
Who Can Use the ABC Analysis Template?
Retailers and E-commerce Sellers
These businesses can use ABC analysis to identify bestsellers, minimize deadstock, and make informed purchasing decisions. Prioritizing popular SKUs ensures shelves and digital catalogs align with demand patterns.
Warehouse and Inventory Managers
ABC analysis simplifies storage optimization. By reserving prime real estate for high-turnover items and minimizing space for low movers, warehouse operations become leaner and more cost-efficient.
Procurement and Supply Chain Teams
Strategic sourcing becomes more targeted when procurement teams know which items drive the most value. ABC classification helps focus negotiations on essential suppliers and consolidate less critical purchasing.
Finance and Operations Executives
Executives gain a clearer picture of asset performance, allowing them to align inventory investments with strategic goals. The classification also supports budgeting and cost control across departments.