Posted on 2 February 2026
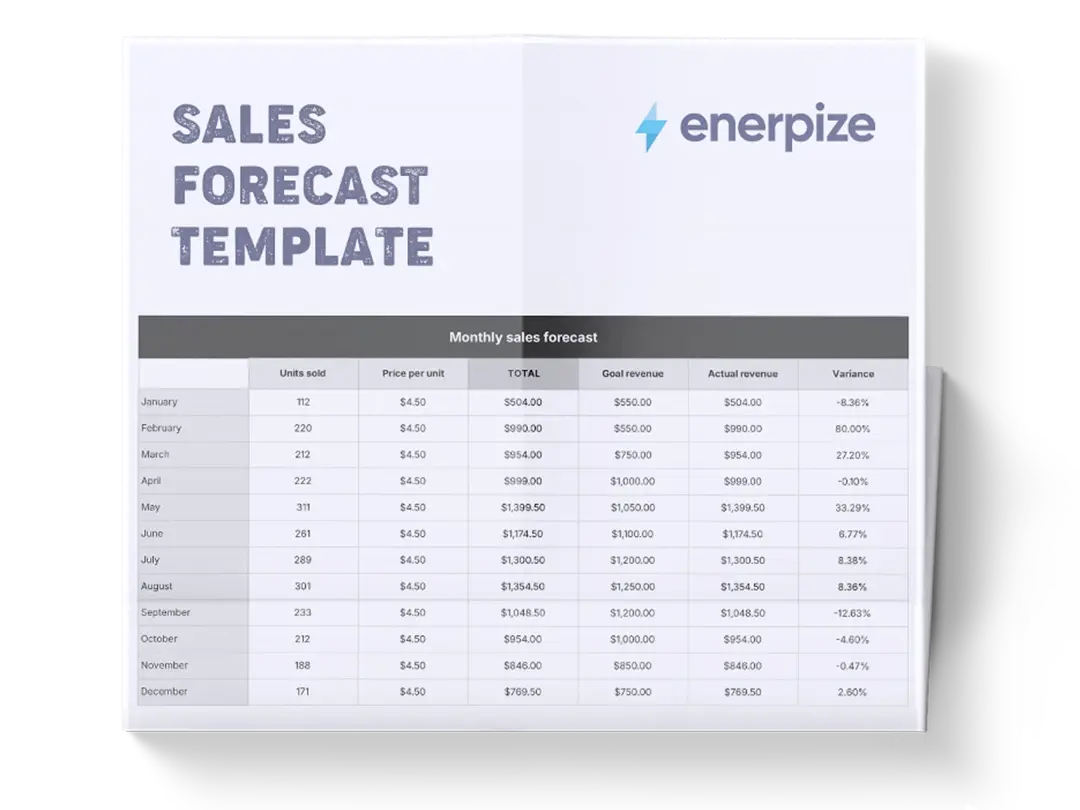
Sales Forecast Template Excel & Google Sheets
- The sales forecast template is available in Excel and Google Sheets.
- It forecasts monthly and annual revenue using unit-based projections.
- Model pricing, cost of goods sold (COGS), and profit margins in one system.
- Gain clear visibility into cash flow, profitability, and growth capacity.


What Is a Sales Forecast Template?
A sales forecast template projects future revenue, costs, and profitability based on unit sales volume, pricing, and cost assumptions. High-level revenue projections that rely on rough percentages or historical averages, but this template models sales performance at the product or service level, allowing businesses to estimate revenue and gross profit with operational precision.
By combining monthly unit sales forecasts, unit pricing, and cost of goods sold (COGS), it creates a dynamic financial model that shows how changes in demand, pricing, or costs directly affect revenue and margins. The result is a forward-looking planning system that supports budgeting, cash flow management, inventory planning, hiring decisions, and strategic growth initiatives. Rather than guessing future performance, businesses can use this template to build realistic projections, stress-test scenarios, and make informed decisions grounded in data.
What Does the Sales Forecast Template Contain?
Business Details
Captures core business information, including business name, address, start date, and contact email, providing context and documentation for financial planning and reporting.
Units Sold
A monthly forecast of how many units are expected to sell for each product or service across the year, concluding with automatically calculated annual totals.
Unit Cost of Goods (COGS)
Records the direct cost of producing or delivering one unit of each product or service for every month, along with the calculated monthly averages.
Unit Price
Defines the selling price per unit for each product or service by month, allowing for seasonal pricing changes and promotional adjustments, with annual averages calculated.
Revenue
Calculates monthly and annual revenue for each product or service based on units sold multiplied by unit price, including consolidated totals.
Margin Per Unit
Displays the difference between unit price and unit cost, showing the gross margin generated per unit sold for each product or service.
Gross Profit
Calculates monthly and annual gross profit by multiplying the margin per unit by units sold, with aggregated totals for financial performance evaluation.
How to Use the Sales Forecast Template
1- Complete Business Details
Begin by entering your business name, address, start date, and business email in the Business Details section. This ensures the document is properly labeled and provides context for internal stakeholders, investors, or lenders reviewing your projections.
2- Forecast Monthly Units Sold
In the Units Sold section, estimate how many units of each product or service you expect to sell every month. This should be grounded in historical sales data, pipeline projections, seasonality patterns, and marketing plans. Each row represents a different product or service, while each column reflects a specific month. Enter conservative but realistic estimates—overstating demand leads to distorted planning, inventory misalignment, and cash flow risk.
Once monthly projections are entered, the template automatically calculates total units sold per product and overall annual totals, allowing you to immediately assess volume expectations.
3- Enter Unit Cost of Goods (COGS)
In the Unit Cost of Goods section, input the direct cost required to produce or deliver one unit of each product or service for each month. This includes materials, manufacturing labor, packaging, shipping, or service delivery costs. If costs fluctuate seasonally or due to supplier pricing changes, reflect those variations. The template calculates average unit costs, providing a useful benchmark for profitability analysis.
4- Input Unit Pricing
Enter your selling price per unit in the Unit Price section. This may vary month-to-month due to promotions, discounts, seasonal pricing, or product bundling strategies. By modeling price changes, you can evaluate how promotional activity or price increases affect total revenue and margins across the year.
5- Review Automated Revenue Calculations
The Revenue section automatically multiplies units sold by unit price to generate monthly and annual revenue projections for each product or service. This provides an immediate view of top-line expectations, both by product line and across the entire business.
6- Analyze Margin Per Unit
The Margin Per Unit section calculates the difference between the unit price and the unit cost. This reveals which products generate the highest profitability and which operate on thinner margins. Monitoring margin trends helps guide pricing strategy, supplier negotiations, and product portfolio decisions.
7- Evaluate Gross Profit Performance
The Gross Profit section multiplies margin per unit by units sold, producing monthly and annual gross profit projections. This is one of the most critical outputs of the template, as it directly reflects how efficiently the business converts sales into profit. Total gross profit figures support operating expense planning, hiring decisions, and long-term growth investments.
8- Interpret Patterns and Adjust Assumptions
Use the full-year view to identify seasonal demand spikes, cost fluctuations, and margin trends. Adjust assumptions iteratively until the forecast reflects a realistic growth trajectory aligned with business capacity and market conditions.
Related Templates
Importance of a Sales Forecast Template
Improves Revenue Predictability and Financial Planning
A structured sales forecast template replaces guesswork with disciplined financial modeling. By projecting monthly unit sales and pricing, businesses gain a realistic picture of expected revenue rather than relying on vague growth targets. This enables accurate budgeting, controlled spending, and responsible hiring. Teams can plan investments based on projected cash inflows, reducing the risk of overextension. Over time, forecasting accuracy improves as assumptions are refined using actual performance data.
Enhances Cost Control and Margin Management
Tracking unit costs alongside pricing exposes margin dynamics that are often overlooked in high-level revenue forecasts. Businesses can quickly identify products with shrinking margins due to rising costs or discounting strategies. This enables proactive supplier negotiations, pricing adjustments, or product redesign before profitability erodes. Margin visibility also supports strategic portfolio decisions, ensuring growth is driven by sustainable profit rather than low-quality revenue.
Supports Strategic Decision-Making and Scenario Planning
By modeling changes in volume, pricing, or costs, the template allows leadership teams to test different scenarios before committing resources. Whether launching a new product, entering a new market, or running promotions, businesses can evaluate financial impact in advance. This reduces risk and increases confidence in growth strategies. Scenario modeling also improves resilience during economic uncertainty by identifying break-even points and downside protection strategies.
Strengthens Cash Flow and Resource Allocation
Accurate forecasting helps businesses align spending with expected inflows. Understanding when revenue peaks or dips occur allows for better working capital management, inventory planning, and payroll scheduling. This prevents liquidity crises that often result from poor planning rather than poor sales. With predictable cash flow, businesses gain operational stability and strategic flexibility.
Who Can Use a Sales Forecast Template?
Startup Founders and Early-Stage Entrepreneurs
Founders need financial clarity without enterprise complexity. This template offers a simple yet robust forecasting system that helps entrepreneurs understand revenue potential, cost structure, and profitability before scaling. It supports fundraising by providing credible projections that investors expect. Founders can test growth assumptions, hiring plans, and pricing strategies without committing to expensive software tools. The result is smarter capital deployment and reduced financial risk.
Small and Medium Business Owners
SME owners benefit from structured forecasting that aligns operations, finance, and growth planning. The template helps them anticipate seasonal fluctuations, plan inventory purchases, and control expenses. It also supports lender discussions by demonstrating financial discipline and revenue visibility. For growing businesses, this tool becomes a financial operating system rather than just a spreadsheet.
Finance Managers and Accountants
Finance professionals use the template to build accurate revenue models, prepare budgets, and monitor profitability trends. The unit-based structure enables granular financial analysis and supports monthly variance reporting. It also simplifies financial communication with leadership by translating complex numbers into understandable projections. Over time, the template supports continuous financial improvement cycles.
Sales and Operations Teams
Sales leaders use forecast outputs to set targets, align quotas, and evaluate pipeline sufficiency. Operations teams rely on unit projections to plan production schedules, staffing levels, and logistics capacity. This alignment prevents operational bottlenecks and ensures the organization can deliver on projected demand. The shared forecasting framework creates cross-functional accountability.
Product-Based and Service-Based Businesses
Whether selling physical products or professional services, the template adapts to both models. Product businesses benefit from inventory and cost modeling, while service firms can forecast project volume, billable hours, and delivery capacity. The flexible structure allows each business to tailor assumptions to its operational reality.
Looking for Beyond Just Forecasting in a Spreadsheet?
While this sales forecast template helps you project revenue, model unit costs, and calculate gross profit, growing businesses often need more advanced capabilities to manage complexity at scale. That’s where Enerpize, our all-in-one ERP platform, comes in.
With Enerpize Sales Management Software, you can:
- Centralize sales forecasting, pricing, and cost data across teams.
- Automate revenue projections, budgeting, and real-time performance tracking.
- Connect sales forecasts directly with inventory, payroll, and financial reporting.
- Gain full visibility into profitability as your operations grow.
If you’re ready to move beyond spreadsheets, Enerpize brings enterprise-grade control to growing teams.