Posted on 2 February 2026
Cost of Sales Spreadsheet Excel & Google Sheets
- The cost of sales spreadsheet is available in Excel and Google Sheets.
- It tracks the true cost of sales at the transaction level, not just monthly totals.
- Understand exactly how labor, materials, and other direct costs impact gross profit.
- Monitor gross margin trends to make smarter pricing and operational decisions.


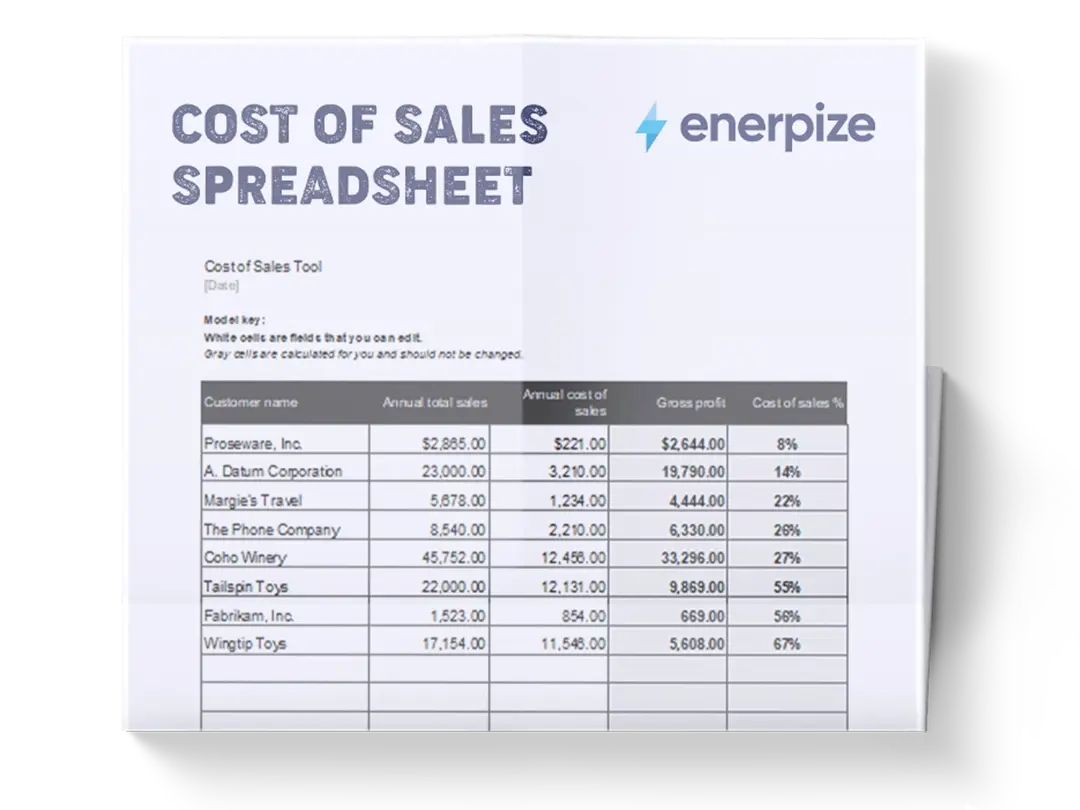
What Is the Cost of Sales Spreadsheet Template?
A Cost of Sales Spreadsheet records revenue alongside all direct costs associated with producing and delivering a product or service. It provides a view of how much each sale actually costs the business, making gross profit and gross margin visible at the transaction level. Unlike high-level income statements that summarize performance after the fact, this spreadsheet captures cost data at the point of sale, allowing for more accurate margin analysis and operational decision-making.
By organizing quantities, unit costs, labor, and other direct expenses in a single place, the spreadsheet creates a reliable system for understanding profitability, identifying cost leakage, and validating pricing strategies. It is especially valuable for businesses where margins fluctuate based on materials, labor intensity, or order size.
What Does the Cost of Sales Spreadsheet Template Contain?
Date
Records the date of the transaction. This establishes a time reference for revenue and cost tracking, supporting period-based analysis and trend identification.
Invoice / Order #
Identifies the specific invoice or order associated with the transaction. This enables traceability between operational records and financial entries.
Product / Service Name
Specifies the item sold or service delivered. This allows profitability to be analyzed at the individual product or service level.
Category
Groups products or services into logical classifications. This supports margin analysis across different offerings without aggregating unrelated costs.
Quantity
Captures the number of units sold or services delivered. This figure drives cost calculations tied to unit-based expenses.
Unit Cost
Represents the direct cost per unit, typically covering materials or inputs required to produce one unit.
Unit Selling Price
Records the price charged per unit. This is the basis for calculating total revenue per transaction.
Direct Labor Cost
Captures labor expenses directly attributable to producing or delivering the product or service.
Other Direct Costs
Includes additional direct expenses tied to the sale, such as packaging, shipping, subcontracting, or transaction-specific fees.
Total Direct Cost
Aggregates all direct costs associated with the transaction, including unit cost, labor, and other direct expenses.
Revenue
Represents total income generated from the transaction, typically calculated using quantity multiplied by unit selling price.
Gross Profit
Shows the difference between Revenue and Total Direct Cost, revealing the actual profit generated before overhead expenses.
Gross Margin
Displays gross profit as a percentage of revenue. This summarizes profitability efficiency across all recorded transactions.
How to Use the Cost of Sales Spreadsheet Template
1- Start by Entering the Transaction Details
Begin with the Date and Invoice / Order # to establish a clear reference for each entry. Every row should represent one completed transaction or sale.
2- Record the Product or Service Accurately
Enter the Product / Service Name exactly as it appears in your operational records. Assign the appropriate Category to ensure consistent grouping for later analysis.
3- Input Quantity and Pricing Data
Fill in the Quantity sold and the Unit Selling Price. These two fields together determine total revenue for the transaction.
4- Capture Unit-Level Production Costs
Enter the Unit Cost associated with producing or sourcing one unit. This should reflect true direct input costs, not estimates or averages unless no alternatives exist.
5- Add Labor and Additional Direct Expenses
Record Direct Labor Cost based on actual time or wages attributable to the transaction. Include any Other Direct Costs that would not exist without this sale.
6- Review Total Direct Cost Calculations
Confirm that Total Direct Cost reflects the sum of unit cost, labor, and other direct expenses. This figure is critical for accurate profit analysis.
7- Analyze Revenue and Gross Profit
Review the Revenue and Gross Profit columns to understand how much each transaction contributes to profitability.
8- Monitor Gross Margin Trends
Use the Gross Margin row to evaluate overall profitability performance. Significant changes in margin often signal pricing issues, cost increases, or inefficiencies.
Related Free Templates
Importance of a Cost of Sales Spreadsheet Template
Reveals true profitability at the transaction level
Many businesses rely on monthly summaries that hide how individual sales perform. A cost-of-sales spreadsheet exposes profitability per order, product, or service by tying revenue directly to the costs required to generate it. This level of visibility helps businesses identify which sales are genuinely profitable and which only appear successful on the surface. Without this clarity, high revenue can mask weak margins.
Over time, transaction-level insight leads to better pricing, smarter sales focus, and healthier growth decisions.
Improves pricing and cost control decisions
By showing how unit costs, labor, and other direct expenses affect gross profit, the spreadsheet creates a factual basis for pricing adjustments. Businesses can see whether margin erosion is caused by rising input costs, inefficient labor allocation, or underpricing. This prevents reactive decisions based on intuition alone. Instead, leaders can adjust prices, renegotiate supplier terms, or redesign delivery processes with confidence. Accurate cost visibility is essential for sustainable margins.
Strengthens financial forecasting and planning
Gross profit and margin trends inform cash flow planning, hiring decisions, and expansion strategies. When cost of sales data is tracked consistently, forecasts become grounded in operational reality rather than optimistic assumptions. This reduces the risk of overextending resources based on inflated expectations. Businesses that understand their true cost structure plan more conservatively and execute more effectively.
Reduces financial blind spots as volume grows
As transaction volume increases, manual tracking and memory-based estimates break down. The spreadsheet introduces discipline and consistency, ensuring that no direct cost is overlooked. This prevents margin leakage that often occurs quietly as businesses scale. By maintaining structured cost tracking, growing teams preserve profitability even as complexity increases.
Who Can Use a Cost of Sales Spreadsheet Template?
Small Business Owners and Founders
Founders often need fast, reliable insight into whether their business model is actually profitable. This spreadsheet gives them a clear view of how revenue translates into gross profit without requiring accounting software expertise. It supports informed decisions about pricing, cost reduction, and growth timing. For owner-operators, it functions as an early warning system against unsustainable margins.
E-commerce and Product-Based Businesses
Businesses selling physical products benefit from tracking unit costs, quantities, and category-level margins. The spreadsheet helps sellers understand which products drive profit and which drain resources once fulfillment and labor are considered. This insight informs inventory planning, promotions, and product line decisions. It is especially useful for businesses managing multiple SKUs with varying cost structures.
Service Providers and Agencies
Service-based businesses often underestimate labor costs, leading to overstated profitability. By explicitly tracking direct labor and other delivery-related expenses, the spreadsheet reveals the real cost of serving each client or project. This supports better scoping, pricing, and workload management. Agencies can use it to compare margin performance across services or client types.
Operations and Finance Managers
Managers responsible for cost control and margin performance use the spreadsheet to monitor efficiency at a granular level. It enables early detection of cost overruns and supports data-driven operational improvements. For teams without a full ERP system, it provides structure and accountability in financial tracking.
Growing Teams Preparing for System Adoption
For businesses not yet ready for accounting or ERP software, this spreadsheet builds cost discipline and financial maturity. It establishes consistent data practices that translate easily into more advanced systems later. Teams that master cost tracking here transition more smoothly when scaling their financial infrastructure.
Looking for Beyond Just Tracking Cost of Sales in a Spreadsheet?
While this cost of sales spreadsheet helps you track direct costs, calculate gross profit, and understand margins, growing businesses often need more advanced capabilities. That’s where Enerpize, our all-in-one ERP platform, comes in.
With Enerpize Sales Management Software, you can:
- Centralize sales, cost, and financial data across the business
- Automate cost calculations, reporting, and margin analysis
- Connect cost of sales with inventory, payroll, and operations
- Gain real-time visibility into profitability as you scale
If you’re ready to move beyond spreadsheets, Enerpize brings enterprise-grade control to growing teams.