Posted on 14 August 2025
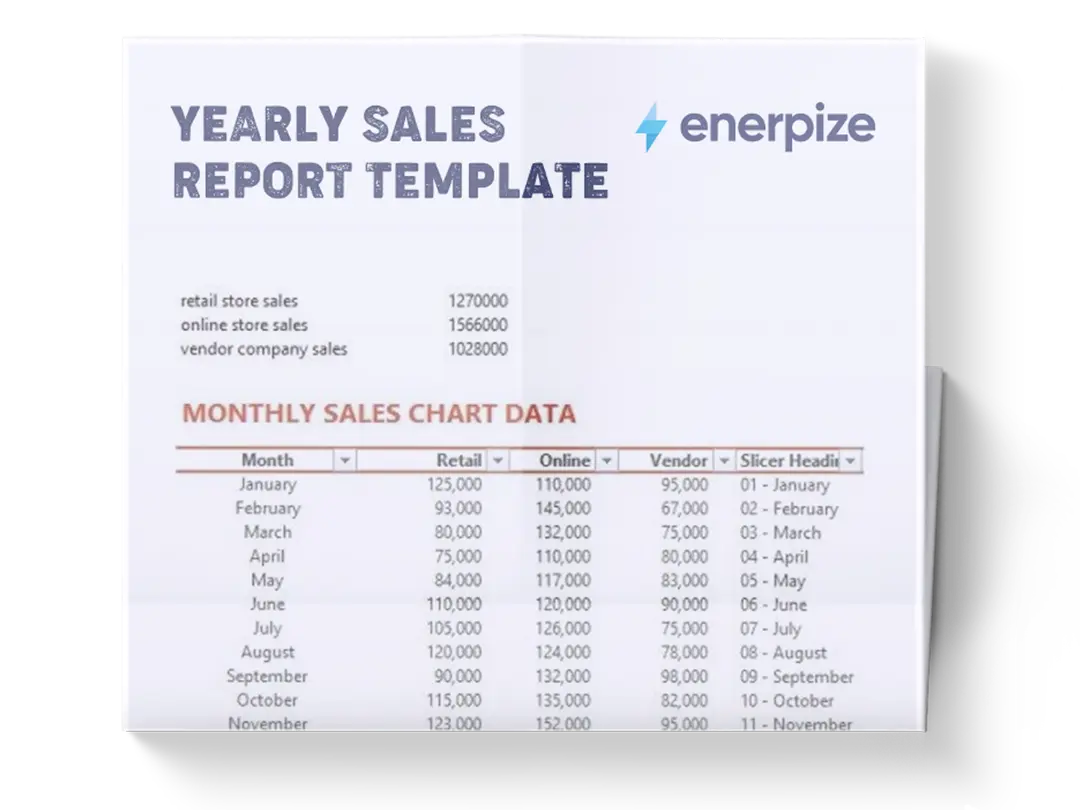
Annual Sales Report Excel & Google Sheets
- The annual sales report is available in Excel and Google Sheets.
- Consolidates key sales data by client, month, quarter, and year for clearer performance insights.
- Supports accurate forecasting and strategic planning through built-in projections.
- Tracks profit margins to evaluate financial health and guide smarter business decisions.


What is the Annual Sales Report?
An annual sales report template summarizes a company’s sales activities, performance, and revenue over a fiscal year. It consolidates critical KPIs, like revenue, units sold, lead conversion rates, customer acquisition, and profit margins, into one centralized overview.
More than a simple record, the sales report Excel file offers in-depth analysis of each stage in the sales funnel and serves as a decision-making tool for leadership. It reveals performance trends, pinpoints bottlenecks, and provides a data-driven foundation for adjusting sales strategies, forecasting growth, and setting new objectives.
What does the Annual Sales Report contain?
Client Name
Each entry starts with the client’s name, helping you track who is bringing in revenue.
Date of Sale
The sale date anchors each transaction chronologically, enabling month-over-month and quarter-over-quarter comparisons. It’s the starting point for all time-based performance analysis.
Month, Quarter, Year
By categorizing each sale into its respective month, quarter, and year, the yearly sales report format in Excel makes it easy to detect seasonal trends, evaluate quarterly momentum, and benchmark annual performance.
Sales Amount
This figure represents the actual deal size. It's your topline input and a baseline for all profitability and forecasting metrics.
Projected Sales
Use this field to record expected revenue. It enables variance analysis by comparing forecasts to reality, helping you refine future projections and avoid overestimations.
Cost
Enter the direct costs tied to each sale, labor, production, logistics, etc. Without this, you can’t measure margin or assess operational efficiency.
Revenue
This reflects net earnings per transaction. It goes beyond sales volume and shows what actually contributes to your bottom line after costs are deducted or upsells are included.
Profit Margin
Automatically calculated, this figure shows profitability as a ratio of cost to sales. It’s the fastest way to evaluate whether a sale was worth it and which deals are draining vs driving profits.
How to Use the Annual Sales Report Template
1- Input Client and Sales Information
Start by entering the name of the client and the exact date of sale.
2- Assign to Month, Quarter, and Year
Use the sales report Excel template’s dropdowns or fields to categorize the sale by its corresponding month, quarter, and year. This segmentation allows you to track sales cycles and performance trends over time.
3- Record Actual Sales Figures
Enter the amount from the closed deal under the SALES column. This is your actual revenue figure before any deductions.
4- Enter Projected Sales (If Available)
Input anticipated revenue into the PROJECTED column based on the existing pipeline or forecasts.
5- Fill in Cost Data
In the COST column, add the total cost associated with delivering the product or service sold to that client—this includes production, labor, logistics, and any variable overhead.
6- Input Total Revenue per Sale
The REVENUE column represents the actual income generated after deducting costs or including added values such as upsells. Ensure this figure reflects true earnings from the deal.
7- Calculate and Interpret Profit Margin
The sales report template Google Sheets uses a formula to determine the PROFIT MARGIN per transaction. This field quantifies profitability and serves as a key performance indicator.
8- Analyze Trends and Take Action
Once populated with data, use the template to evaluate:
- Which quarters generated the highest revenue?
- Are projected sales consistently above or below actuals?
- Which clients yield the highest profit margins?
9- Maintain and Review Regularly
Update the sale report template Excel monthly to keep your data fresh. Archive old versions quarterly to preserve historical context.
Related Templates:
Importance of the Annual Sales Report
Tracks Performance Over Time
The report enables businesses to measure Annual performance, providing clear visibility into what worked, what didn’t, and why.
Enables Data-Driven Decision-Making
When decisions are based on intuition or partial data, businesses risk stagnation or missteps. An annual sales report equips managers with hard numbers across product lines, customer segments, and sales teams to drive decisions around hiring, pricing, training, and go-to-market strategies with precision and confidence.
Supports Strategic Goal Setting
By highlighting both successes and shortcomings, the report becomes the basis for realistic, measurable goals. Sales leaders can calibrate objectives that are ambitious but grounded in historical performance, setting the stage for better accountability and execution.
Improves Visibility Across the Organization
A well-prepared annual sales report eliminates guesswork and micromanagement. It gives executives, marketing teams, and other departments a clear view of the sales landscape, reducing the need for constant status updates and enabling better cross-functional alignment.
Reveals Sales Funnel Bottlenecks
Whether leads are stalling at the qualification stage or deals are dying during closing, the report reveals precisely where sales efforts are breaking down. This insight allows teams to adjust their processes and plug revenue leaks—without wasting time chasing the wrong problems.
Highlights Trends and Customer Behavior
Annual data reveals patterns too subtle for short-term reports to detect. Businesses can spot which products are rising stars, which customer segments are disengaging, and how consumer preferences are shifting. This leads to smarter marketing, improved targeting, and better inventory and pricing strategies.
Enhances Investor and Stakeholder Communication
For companies reporting to investors, the Annual sales report is a critical transparency tool. It shows not only how the company performed but also how it plans to evolve, instilling confidence in stakeholders about the business’s direction and financial health.
Reduces Operational Waste
By exposing underperforming channels, inefficient sales tactics, or unproductive team behavior, the report helps streamline operations. Instead of reacting blindly to symptoms, teams can identify root causes and make targeted interventions.
Who Can Use the Annual sales report?
Sales Managers and Team Leads
They use the report to monitor progress, evaluate team performance, and fine-tune strategies. It gives them the insight to coach effectively, allocate resources wisely, and hit their revenue targets with fewer surprises.
Executives and Leadership Teams
Executives rely on annual sales data to inform high-level decisions around expansion, investment, and organizational strategy.
Marketing Teams
Marketing can leverage sales trends and conversion data to refine campaigns, better target high-converting segments, and align messaging with what’s actually driving revenue. It bridges the gap between brand awareness and closed deals.
Finance and Accounting Departments
Annual sales figures are crucial for budgeting, financial forecasting, and tax reporting. Finance teams use this data to assess the business’s fiscal health, determine capital allocation, and prepare for investor relations or audit reviews.
Investors and Shareholders
Stakeholders outside the business—like board members or venture partners—use the report to assess performance, gauge risk, and decide whether to increase investment or change direction.