Posted on 8 February 2026
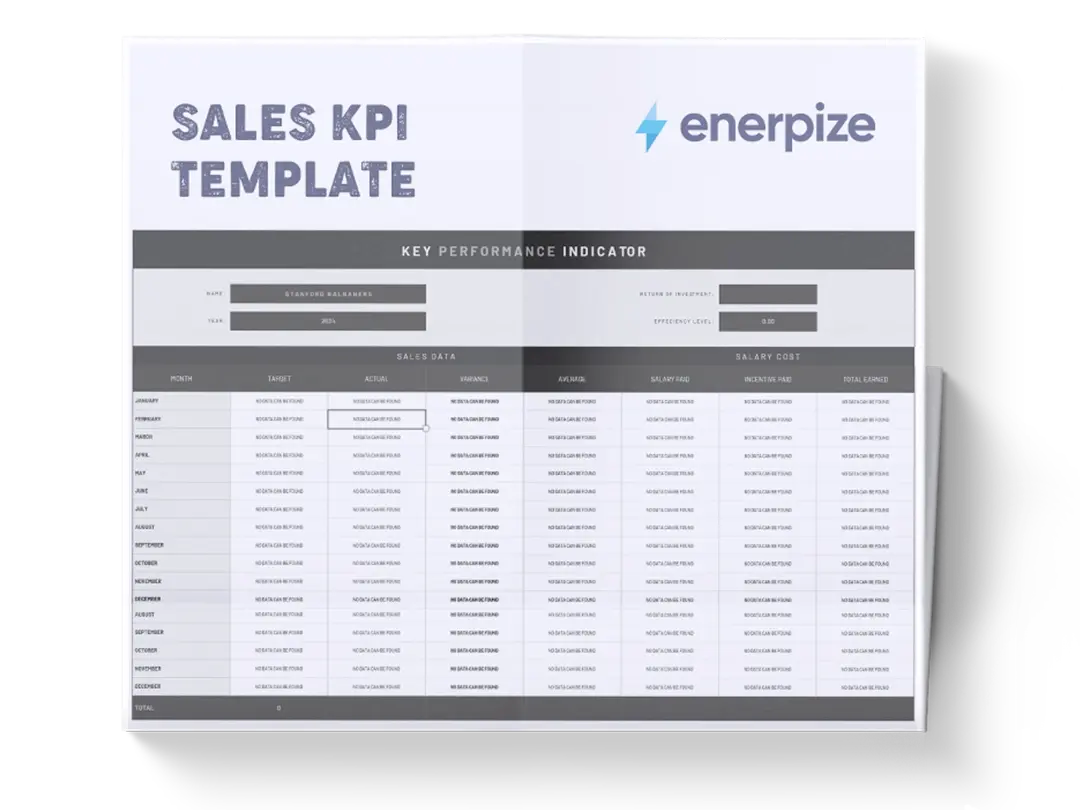
Sales KPI Template Excel & Google Sheets
- Sales KPI Template Excel & Google Sheets.
- It monitors end-to-end sales funnel performance from lead generation to closed revenue.
- Diagnose conversion drop-offs, efficiency gaps, and quota risks using auto-calculated KPIs.
- Align sales, marketing, and revenue targets using a single performance snapshot.


What Is a Sales KPI Template?
A Sales analytics KPI Template is a performance measurement tool that tracks, calculates, and interprets the most critical indicators of sales effectiveness across the entire revenue funnel. Rather than focusing on individual deals or activities, it aggregates lead volume, conversion stages, revenue outcomes, and cost efficiency into a single structured view. This allows teams to understand not just how much revenue was generated, but how efficiently it was generated and where performance breaks down.
By combining raw input metrics (such as total leads, qualified leads, and revenue) with automatically calculated KPIs (such as win rate, CAC, and quota attainment), the template functions as both a diagnostic and decision-making instrument. It is particularly valuable for identifying funnel leakage, misalignment between sales and marketing, and performance gaps that are not visible through revenue totals alone.
What Does the Sales KPI Template Contain?
Total Leads
Captures the total number of leads generated during the period. This represents the top of the sales funnel and serves as the baseline for all downstream conversion metrics.
Marketing-Qualified Leads (MQLs)
Records the number of leads that meet predefined marketing qualification criteria. This field reflects lead quality and marketing effectiveness.
Sales-Qualified Leads (SQLs)
Tracks leads that have been vetted and accepted by sales. This metric indicates alignment between marketing and sales qualification standards.
Opportunities Created
Represents the number of qualified opportunities formally entered into the sales process. This shows how many SQLs progress into active selling efforts.
Closed-Won Deals
Counts the number of opportunities that successfully converted into customers. This is the final output of the funnel.
Sales Revenue Quota
Defines the revenue target for the period. This establishes the benchmark against which actual performance is evaluated.
Total Revenue
Captures actual revenue generated from closed-won deals. This is used to calculate attainment and average deal size.
Marketing + Sales Spend
Records the combined cost of sales and marketing activities for the period. This input is required for cost-efficiency metrics.
Total New Customers
Counts the number of customers acquired. This connects revenue outcomes to customer acquisition efficiency.
Sales Cycle (Average Days)
Measures the average length of time required to close a deal. This provides context for velocity and forecasting accuracy.
Lead-to-MQL Rate (Auto-Calculated KPI)
Calculates the percentage of total leads that convert into MQLs, indicating marketing qualification effectiveness.
MQL-to-SQL Rate (Auto-Calculated KPI)
Measures how many marketing-qualified leads are accepted by sales, revealing lead quality and handoff alignment.
SQL-to-Opportunity Rate (Auto-Calculated KPI)
Shows how effectively sales converts qualified leads into real opportunities.
Win Rate (Auto-Calculated KPI)
Calculates the percentage of opportunities that close successfully. This reflects sales execution quality.
Average Deal Size (Auto-Calculated KPI)
Derives average revenue per closed deal, providing insight into deal value consistency.
Customer Acquisition Cost (CAC) (Auto-Calculated KPI)
Calculates the average cost to acquire a single customer based on total spend and customers acquired.
Cost Per Lead (CPL) (Auto-Calculated KPI)
Measures how much is spent to generate each lead, indicating marketing efficiency.
Quota Attainment (Auto-Calculated KPI)
Calculates actual revenue as a percentage of quota, summarizing overall performance against targets.
How to Use the Sales KPI Template?
1- Start by Defining the Reporting Period
Before entering any data, ensure the template reflects a consistent time frame (monthly, quarterly, or campaign-based). All inputs should correspond to the same period to maintain accuracy.
2- Enter Top-Of-Funnel Lead Volume
Begin with Total Leads. This anchors the entire funnel and directly impacts conversion rate calculations downstream.
3- Populate Qualification Stages Sequentially
Enter values for MQLs, then SQLs, then Opportunities Created. Each figure should logically decrease, reflecting funnel progression rather than aspiration.
4- Record Closed Outcomes Accurately
Enter Closed-Won Deals and Total New Customers based strictly on completed transactions. Avoid including pending or verbal commitments.
5- Input Revenue Targets and Actuals
Add the Sales Revenue Quota first, followed by Total Revenue. These fields drive quota attainment and average deal size calculations.
6- Add Combined Spend Deliberately
Enter Marketing + Sales Spend using actual costs, not estimates. This ensures CAC and CPL reflect true efficiency.
7- Confirm Sales Cycle Duration
Enter the average number of days to close deals during the period. This contextualizes performance speed and forecasting reliability.
8- Review Auto-Calculated KPIs
Once inputs are complete, review all KPI fields. These calculations reveal funnel health, efficiency, and alignment issues without additional formulas.
9- Analyze Relationships
Look for imbalances, strong lead volume with weak conversion, high revenue with poor efficiency, or high attainment driven by unsustainable spend.
10- Use Findings to Inform Action
The template is not a reporting tool; it is a diagnostic tool. Use it to adjust qualification criteria, reallocate budget, or reset quotas based on evidence.
Related Templates
Importance of a Sales KPI Template
Reveals Where Revenue Leakage Actually Occurs
Most sales teams know their revenue number but cannot explain why they missed or hit it. This kpi dashboard template exposes exactly where leads drop off, whether at qualification, opportunity creation, or closing.
Breaking performance into measurable stages eliminates guesswork and surface-level explanations. Leaders can identify whether problems stem from lead quality, sales execution, or funnel velocity. This clarity enables targeted fixes rather than broad, ineffective interventions.
Aligns Sales and Marketing Around Shared Performance Metrics
Misalignment often occurs when marketing optimizes for volume while sales optimizes for closability. The shared KPIs in this template, such as Lead-to-MQL and MQL-to-SQL rates, force both teams to operate against the same reality. Poor conversion becomes a joint problem rather than a departmental blame game. Over time, this alignment improves lead quality, sales acceptance, and overall efficiency. The result is a more cohesive revenue engine.
Improves Forecast Confidence and Quota Planning
Revenue forecasts fail when they ignore conversion math and cycle length. By tying quota attainment to win rate, deal size, and sales cycle data, the template grounds targets in operational reality. Leaders can assess whether quotas are aggressive but achievable, or structurally unrealistic. This improves planning decisions related to hiring, spending, and growth pacing. Forecasts become credible tools rather than optimistic guesses.
Exposes Efficiency, Not Just Growth
Revenue growth without efficiency is fragile. The inclusion of CAC and CPL ensures performance is evaluated alongside cost. Teams can quickly see whether growth is being bought at an unsustainable price. This is especially critical during scaling phases or budget tightening. The template protects businesses from chasing top-line numbers that quietly erode profitability.
Who Can Use a Sales KPI Template?
Startup Founders and Early-Stage Operators
Founders often lack visibility into why sales feel unpredictable. This template gives them a structured lens into funnel performance without requiring complex systems. It helps founders understand whether growth issues stem from lead volume, conversion quality, or execution gaps. With limited resources, this insight is critical for deciding where to invest next. It also provides investors with clear, defensible performance metrics.
Sales Managers and Revenue Leaders
Managers need more than closed revenue to coach effectively. This template reveals how reps move deals through each stage and where breakdowns occur. It supports objective performance discussions grounded in data rather than anecdotes. Managers can identify whether issues require training, process changes, or pipeline support. This leads to more precise, impactful leadership.
Marketing Managers Focused on ROI
For marketing leaders, lead volume alone is meaningless without downstream impact. The template connects marketing output to revenue outcomes and acquisition cost. This allows marketers to defend budget decisions with concrete efficiency metrics. It also highlights when lead quality, not quantity, is the real constraint. Marketing strategy becomes accountable and revenue-aligned.
Finance and Operations Teams Supporting Growth
Finance teams rely on accurate inputs for cash flow, hiring, and budget planning. This template provides an operational bridge between sales activity and financial forecasting. CAC, quota attainment, and cycle length inform smarter financial decisions. Operations teams can also use the data to anticipate scaling bottlenecks. The result is fewer surprises and tighter control.
Looking for Beyond Just Tracking Sales KPIs in a Spreadsheet?
While this Sales KPI Template helps you measure funnel performance, efficiency, and quota attainment, growing businesses often need more advanced capabilities. That’s where Enerpize, our all-in-one ERP platform, comes in.
With Enerpize sales management software, you can:
- Centralize sales KPIs, pipelines, and customer data in one system
- Automate performance reporting, alerts, and cross-team visibility
- Connect sales outcomes directly to finance, operations, and planning
If you’re ready to move beyond spreadsheets, Enerpize brings enterprise-grade control to growing teams.