Posted on 5 October 2025
Chart of Accounts Template Excel & Google Sheets
- The chart of accounts template is available in Excel and Google Sheets.
- Organizes all accounts into a clear structure, whether assets, liabilities, equity, income, expenses, or taxes.
- Improves accuracy in bookkeeping and reporting to ensure consistency across financial statements.
- Supports compliance and business insights for simplified audits, tax filings, and financial analysis.


What is a Chart of Accounts Template?
A chart of accounts (COA) template is a structured index of all the financial accounts in a company’s general ledger, categorized into assets, liabilities, equity, revenue, and expenses. Unlike a trial balance that only displays active accounts with balances, a COA lists every account available in the accounting system, serving as a master reference for recording transactions. Each account is typically assigned a unique code and descriptive name, ensuring consistency in financial reporting.
By functioning as the backbone of financial organization, a chart of accounts enables accurate bookkeeping, supports compliance with accounting standards, and ensures that key financial statements—such as the balance sheet and income statement—reflect precise, well-structured data.
Your Chart of Accounts, Built In. Enerpize comes with a ready-made chart of accounts you can customize to your business — no setup headaches, no formatting required. Start for free.
What does the Chart of Accounts Template Contain?
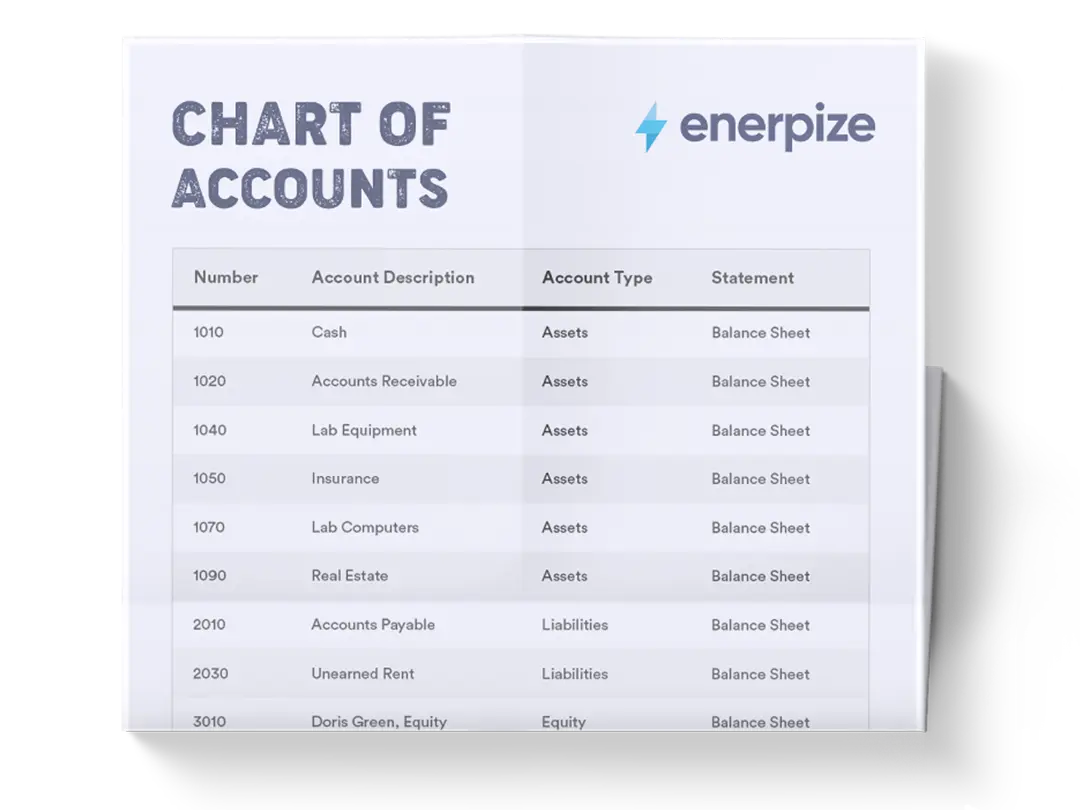
Account Number
Each account is assigned a unique numerical code (e.g., 1000 for Cash, 2000 for Accounts Payable). This numbering system makes it easy to sort, reference, and expand the chart as your business grows. For example, asset accounts fall in the 1000–1999 range, while revenue accounts occupy the 4000–4999 range.
Having this logical structure helps accountants quickly locate transactions and avoid confusion when preparing reports.
Account Name
This column specifies what the account represents—such as “Bank – Operating” or “Sales Revenue.” Clear naming conventions reduce ambiguity and ensure that even non-accountants can understand what each account is for. Businesses often customize names to match industry-specific needs (e.g., “Inventory – Mangoes” for an agricultural business).
Financial Statement Classification
Each account is tied directly to the financial statement it belongs to: Balance Sheet, Profit & Loss (P&L), or Other Reports. For instance, “Fixed Assets” belong to the Balance Sheet, while “Service Revenue” flows into the P&L.
This mapping ensures your chart of accounts template seamlessly integrates into financial statements, giving stakeholders reliable insights.
Account Type
Categories such as Current Asset, Liability, Equity, Income, or Expense clarify how each account functions. These types also determine how accounting software organizes transactions, making automation possible. For example, marking “Accounts Payable” as a Current Liability ensures it shows up in the correct section of the Balance Sheet.
Normal Balance
This field specifies whether an account typically carries a Debit or Credit balance. For example, assets normally carry a Debit balance, while liabilities carry a Credit balance. Including this detail helps prevent posting errors, as accountants can quickly see whether a transaction looks unusual.
Tax Category
This column identifies how accounts interact with tax reporting—such as “Payroll Taxes,” “Sales Tax,” or “Income Tax.” Tagging accounts with tax categories is critical for compliance, ensuring nothing is missed during filings. For businesses in regulated industries, this feature reduces audit risk by making tax implications clear.
Notes
The notes section explains account usage, policies, or exceptions. For instance, “Undeposited Funds – for checks not yet deposited” or “Lease Liability – per new GAAP/IFRS rules.” These instructions improve clarity, especially when multiple users are working in the same accounting system, and serve as a reference during training or audits.
How to Use the Chart of Accounts Template
1- Customize the Template for Your Business
Start by tailoring the account names and categories to reflect your operations. A manufacturer may need detailed subaccounts under “Inventory” (raw materials, work-in-progress, finished goods), while a consulting firm may need multiple revenue accounts for different service lines.
Adjusting the chart of accounts template ensures it reflects your business model accurately.
2- Assign Account Numbers Logically
Stick to the numbering sequence provided in the COA template—assets in the 1000s, liabilities in the 2000s, equity in the 3000s, and so on. This keeps everything organized and scalable. If you anticipate growth, leave gaps between numbers (e.g., 4010 for Product A, 4020 for Product B, leaving space for 4015 later). A well-structured numbering system prevents messy reorganization down the road.
3- Maintain Consistency in Transactions
Train your team to use the correct accounts every time. Misclassifying transactions—for example, posting office supplies under “COGS” instead of “Operating Expenses”—can distort profit margins and mislead management. Consistency ensures reports are accurate, comparable over time, and audit-ready.
4- Use Subaccounts for Granularity
The chart of accounts template Excel includes parent accounts with subaccounts (e.g., Inventory > Mangoes, Peppers). Subaccounts allow you to track details without cluttering high-level reports. For instance, you can see both the total “Inventory” and a breakdown by product line. Use this feature strategically to balance simplicity and detail.
5- Leverage Notes for Training and Audits
The Notes column is your internal guidebook. Document how to use each account, specify which transactions belong where, and add compliance reminders. This reduces onboarding time for new employees and minimizes interpretation errors. During audits, well-documented notes demonstrate strong internal controls.
6- Review and Update Regularly
A chart of accounts isn’t static. As your business evolves—launching new products, opening subsidiaries, or expanding internationally—you’ll need to add or modify accounts. Schedule annual reviews to prune unused accounts and align with updated tax or accounting standards. An outdated COA is as dangerous as no COA at all.
7- Use the COA for Analysis and Decision-Making
Beyond bookkeeping, your chart of accounts template supports financial insights. For example, splitting “Marketing” into “Digital Ads” and “Events” helps track ROI per channel. Separating “Product Sales – A” from “Product Sales – B” shows which line drives profitability. By structuring your accounts strategically, you create better data for management decisions.
Stop Maintaining Spreadsheets. Enerpize organizes every account, auto-posts transactions to the right place, and keeps your books aligned with GAAP and IFRS standards. Start for free.
Importance of the Chart of Accounts Template
Effortless Financial Reporting
A properly designed COA makes generating financial statements—such as balance sheets and income statements—straightforward. Organizing accounts into logical categories allows business leaders to track performance, analyze trends, and make strategic decisions with confidence. Without this structure, reporting often becomes fragmented and error-prone.
Streamlined Accounting Processes
Categorization reduces confusion when recording transactions and minimizes bookkeeping errors. This efficiency not only accelerates routine accounting tasks but also simplifies tax preparation and ensures adherence to regulatory standards.
A chart of accounts is effectively a roadmap, guiding accountants to the right account every time.
Clarity in Business Performance
An organized COA provides a real-time snapshot of a company’s financial health. Business owners and investors can quickly evaluate profitability, cost control, and capital structure, all from a central reference point. This clarity is critical for making informed operational and investment decisions.
Fraud Detection and Risk Management
Because a chart of accounts template maintains a complete, traceable record of all accounts, it makes identifying discrepancies and unusual activity easier. This transparency helps businesses flag potential fraud or financial mismanagement early—before problems escalate into serious losses.
Compliance and Standardization
With evolving accounting regulations like GAAP or IFRS, businesses must maintain consistency in financial reporting. A COA ensures standardized account usage across departments and periods, reducing the risk of non-compliance and making audits more efficient.
Who Can Use the Chart of Accounts Template?
Small and Medium-Sized Businesses (SMBs)
For growing companies, a COA provides much-needed structure to prevent financial records from becoming chaotic. It gives small business owners a clear overview of cash flow, expenses, and profitability, which is essential for sustainability and scaling.
Large Enterprises
Enterprises with multiple departments or subsidiaries benefit from a COA’s standardization. It allows consistent categorization of financial data across units, enabling accurate consolidation and comparative analysis across divisions, regions, or reporting periods.
Startups and Entrepreneurs
Early-stage companies often underestimate the value of structured financial records. Using a chart of accounts template from day one ensures that financial data remains organized as the business grows, making it easier to secure investment and demonstrate fiscal discipline to stakeholders.
Nonprofits and Government Entities
Organizations outside the for-profit sector also rely on COAs to maintain accountability. For nonprofits, it helps track restricted versus unrestricted funds, ensuring compliance with donor requirements. Government entities use charts of accounts to align with strict reporting standards and maintain public trust.
Accountants and Financial Teams
For professionals managing company finances, a chart of accounts template is a practical tool that centralizes all accounts, saves time during audits and tax preparation, and supports accurate financial analysis. It’s not just a record—it’s the foundation for effective financial management.
From Startups to Enterprises, Enerpize Has Your Books Covered. Get a structured, scalable chart of accounts built into your accounting software and spend less time on records, more time on growth. Start for free.