Posted on 7 December 2025
Annual Business Report Template Excel & Google Sheets
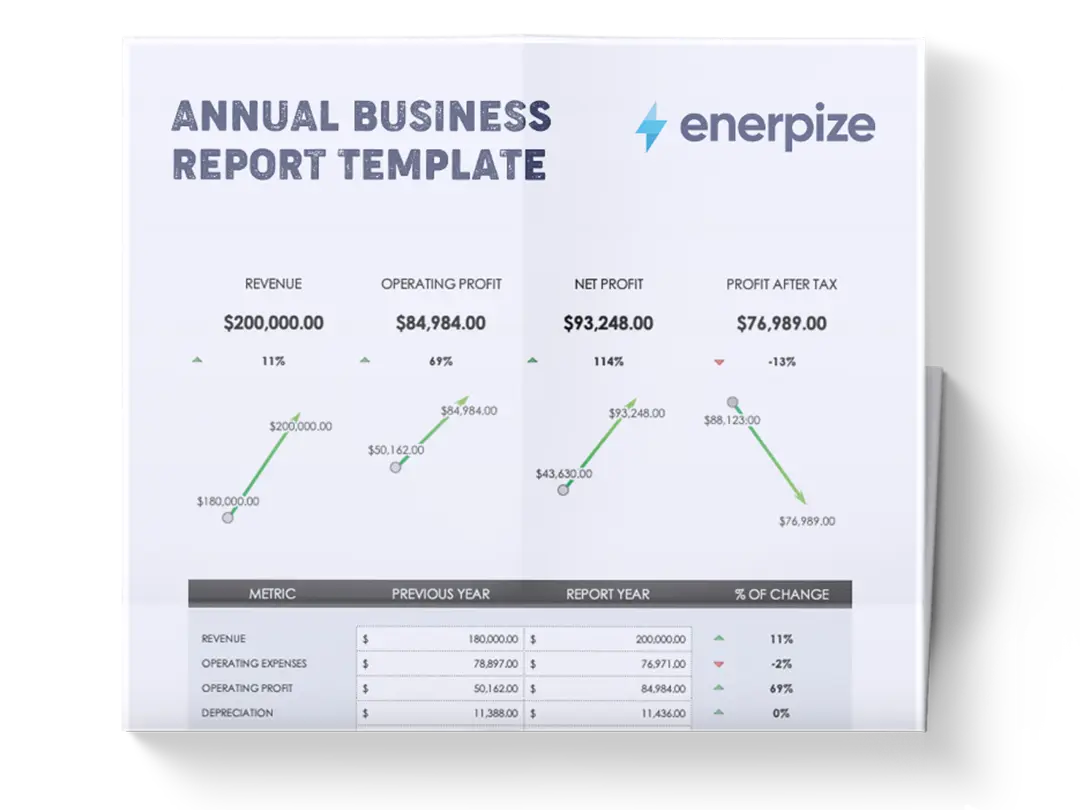
- The annual business report template is available in Excel and Google Sheets.
- It provides a complete, month-by-month breakdown of P&L and Balance Sheet categories to assess operational and financial performance.
- Tracks Budget vs. Actual vs. Variance for every metric, giving you immediate insights into where performance is on target or off track.
- Ideal for business owners and managers who need a clear, structured format for annual reporting, decision-making, and year-end planning.


What is the Annual Business Report Template?
The Annual Business Expense Report Template provides a clear and precise evaluation of a business's performance over an entire year. The template tracks budgeted amounts, actual results, and the resulting variances, while also capturing previous-year performance for comparative analysis.
With quarterly totals and a consolidated year-end summary, the template provides a unified view of short-term fluctuations and long-term trends.
What Does the Annual Business Report Template Contain?
Profit & Loss Category
The annual report template includes Revenue, Cost of Goods Sold (COGS), sales and marketing costs, Labor Costs, administrative and general expenses, EBIT (Earnings Before Interest & Taxes), and an "Other" category for additional income or expenses. Each of these lines contains monthly columns along with quarterly totals, a Year Total, and columns for Budget, Actual, Variance, Previous Year Actual, and Previous Year Variance.
Balance Sheet Category
It also includes Cash, Inventory, Accounts Receivable, Net Fixed Assets, Accounts Payable, Long-Term Debt, and an Other category for additional assets or liabilities. This section follows the same monthly, quarterly, and yearly layout, with corresponding Budget, Actual, Variance, Previous Year Actual, and Previous Year Variance columns where applicable.
How to Use the Annual Business Report Template
1- Begin with Profit & Loss (P&L) Categories at The Top
The template is structured to assess operational performance first, so start by filling in all relevant P&L numbers.
For every p&l category:
- Enter the monthly budget values: input the planned amounts for Jan through Dec.
- Enter actual values for each month: these must be real figures pulled from your accounting records.
- Review the automatic variance row: the template displays differences between the budget and actual.
- Add previous year actual values: this enables year-over-year insights.
- Review previous year variance: this row highlights how current-year performance compares to last year.
2- As You Fill Monthly Data, Monitor the Quarterly Totals
Q1, Q2, Q3, and Q4 totals populate from the monthly entries and give you a more structured view of seasonality and performance cycles.
3- Continue Entering Data Through All P&L Categories
Proceed from Revenue down through COGS, Sales/Marketing, Labor, Admin/General, EBIT, and Other, following the same system of Budget, Actual, to Variance.
4- Move to The Balance Sheet Category
After completing the P&L portion, scroll down to the Balance Sheet section.
Follow the same five-line structure: Budget, Actual, Variance, Previous Year Actual, Previous Year Variance.
5- Complete Entries for All Balance Sheet Categories
Enter data for:
- Cash
- Inventory
- Accounts Receivable
- Net Fixed Assets
- Accounts Payable
- Long-Term Debt
- Other
6- Review Year Totals at The Far Right
These totals consolidate the entire year’s activity and serve as the final annual summary.
7- Validate Consistency Across P&L and Balance Sheet
Once all areas are completed, check that:
- Quarterly totals match their corresponding months
- Year totals align numerically
- Variances are reasonable and logically interpretable
- Previous year comparisons make sense historically
8- Use the Full Completed Report for Analysis, Planning, and Reporting
Once finalized, your completed entries create a structured, comprehensive annual business report suitable for internal meetings, strategic planning, investor updates, or year-end reviews.
Related Templates
Profit and Loss Statement Template
Business Expenses Spreadsheet Template
Financial Analysis Report Template
Importance of the Annual Business Report Template
Strengthens Financial Visibility
A full year of monthly, quarterly, and annual data provides unmatched clarity into how the business performs over time. The template helps leaders identify growth patterns, cost inefficiencies, and operational risks before they escalate. This level of transparency is essential for informed decision-making and strategic planning.
Enables Precise Budget vs. Actual Tracking
Seeing budgeted amounts alongside actual results allows managers to detect overspending or underperformance early. The built-in variance lines reveal exactly where assumptions were inaccurate, making each new planning cycle progressively more accurate and realistic.
Provides Year-Over-Year Comparisons
The “Previous Year Actual” and “Previous Year Variance” lines make it easy to measure progress over time. These comparisons are crucial for identifying long-term trends, seasonal cycles, and structural changes in revenue, cost behavior, or capital needs.
Unifies P&L and Balance Sheet in One Report
Having both statements integrated in a single template allows businesses to see the connection between operational performance and financial health. For example: higher revenue may not matter if cash, receivables, or payables are misaligned. This template brings those relationships into clear focus.
Makes Annual Reporting Faster and More Professional
Instead of compiling numbers from multiple spreadsheets, everything is structured, standardized, and ready for presentation. This saves significant time during year-end closing and supports clear communication with stakeholders.
Who Can Use the Annual Business Report Template?
Small Business Owners
Owners gain a structured, reliable system for understanding how their business performed throughout the year—without needing advanced accounting software. The template helps them evaluate profitability, manage cash flow, and prepare for taxes or financing.
Financial Managers & Controllers
Professionals responsible for budgeting, forecasting, and reporting can use this template to consolidate financial data, track performance, and produce annual reports for executive teams with consistency and accuracy.
Startups & Growing Companies
Early-stage businesses can track their financial trajectory month by month, enabling better planning for investment rounds, hiring, scaling decisions, or burn-rate management.
Consultants & Advisors
Advisors can use this template to analyze clients’ financials, identify operational issues, and propose data-backed improvements. It provides a standardized format that makes analysis faster and more effective.
Nonprofits & Project-Based Organizations
Any organization with budgets, expenses, and annual reporting obligations can leverage this template to maintain financial accountability and demonstrate transparent stewardship of resources.