Posted on 8 December 2025
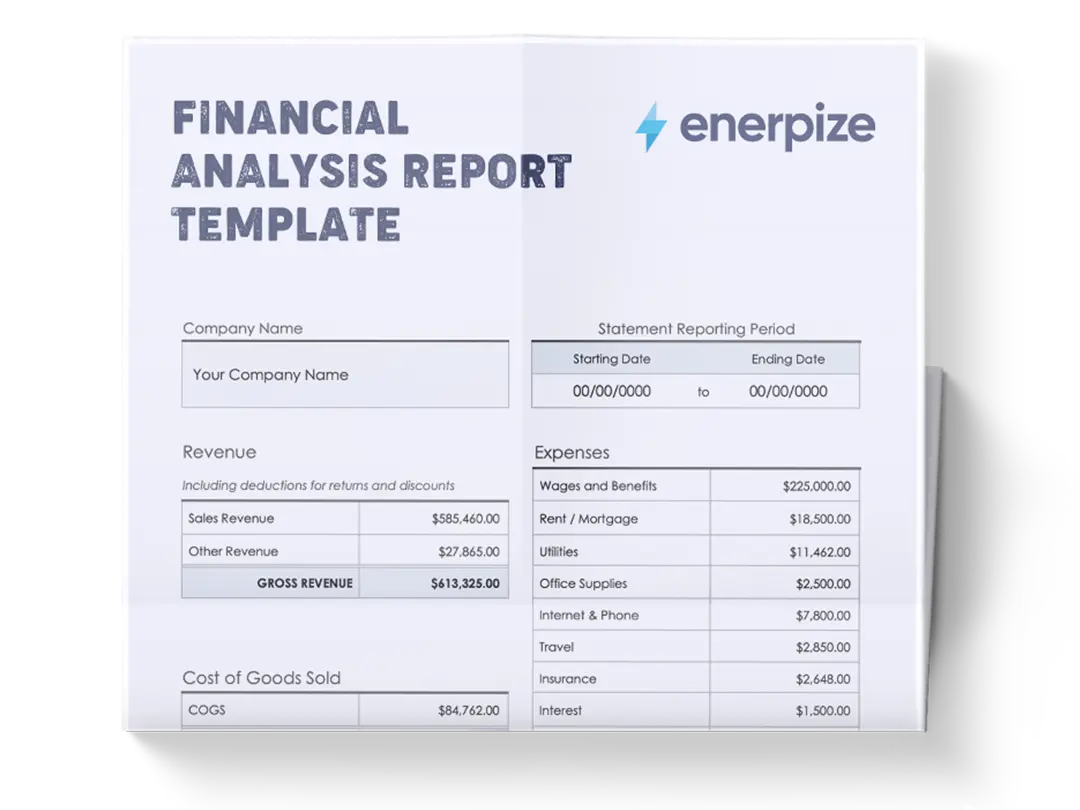
Financial Analysis Report Template Excel & Word
- The financial analysis report template is available in Excel, Word, Google Docs, and Google Sheets.
- It provides a structured framework for tracking and analyzing revenue, costs, profits, and financial ratios.
- Includes Profit & Loss, Balance Sheet, Cash Flow Statement, and key financial ratios for in-depth insights.
- Ideal for managers, accountants, and business owners seeking accurate, actionable financial data to guide strategy.


What is the Financial Analysis Report Template?
A financial report template consolidates and interprets a company’s financial data to allow your business to track revenue, expenses, profit margins, assets, liabilities, and cash flows. By comparing budgeted, actual, and prior-year figures, the template highlights variances, identifies trends, and pinpoints areas requiring attention.
This financial analysis template integrates gross and net profit margins, working capital, current ratios, and debt-to-equity ratios. It serves as both a reporting tool and a decision-making framework to assess operational efficiency, liquidity, profitability, and overall financial health.
Your Financial Reports, Generated Automatically. Enerpize pulls your P&L, balance sheet, cash flow, and ratios into real-time reports the moment transactions are recorded — no template needed. Start for free.
What Does The Financial Analysis Report Template Contain?
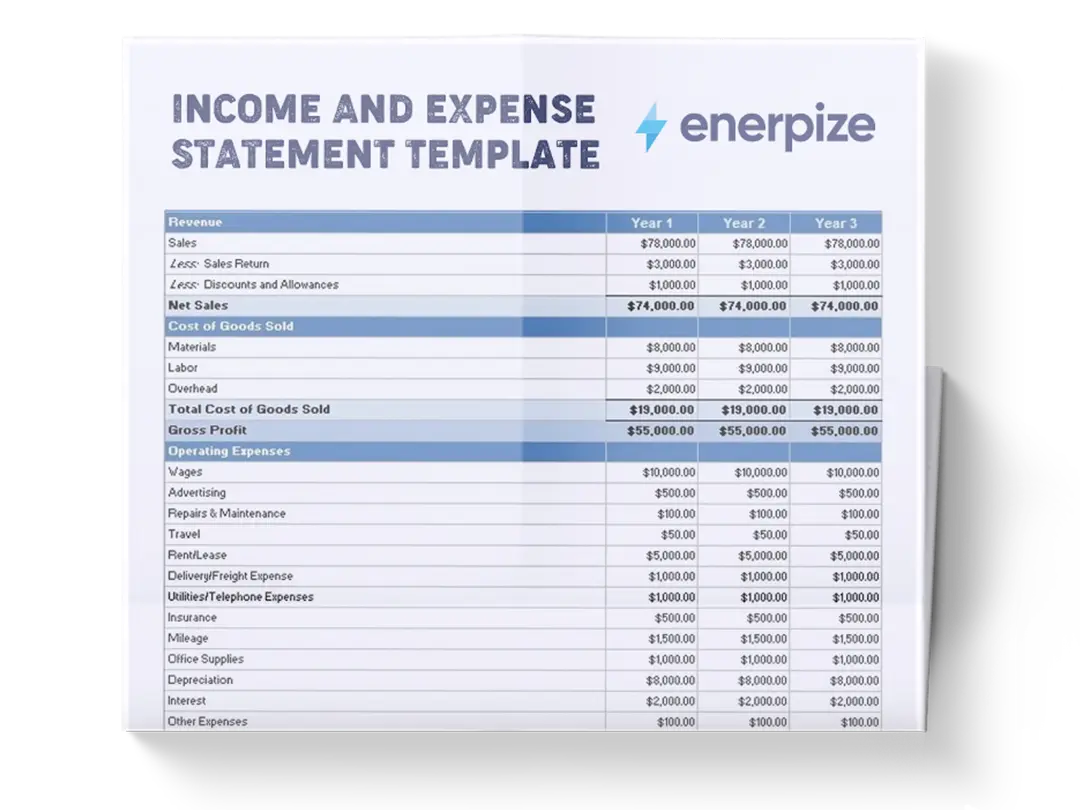
1- Profit & Loss (P&L) Statement
- Revenue: Total income generated from sales or services, including comparisons to budget and prior-year figures.
- COGS (Cost of Goods Sold): Direct costs associated with producing goods or delivering services.
- Gross Profit: Revenue minus COGS, reflecting the core profitability before overheads.
- Sales & Marketing Expenses: Costs related to promoting products and generating sales.
- Labor Costs: Employee wages, benefits, and related personnel expenses.
- Admin/General Expenses: Overhead costs not tied directly to production or sales.
- EBIT (Earnings Before Interest & Taxes): Operating profit, indicating operational efficiency.
- Net Profit: Bottom-line profit after all expenses, a key indicator of overall financial performance.
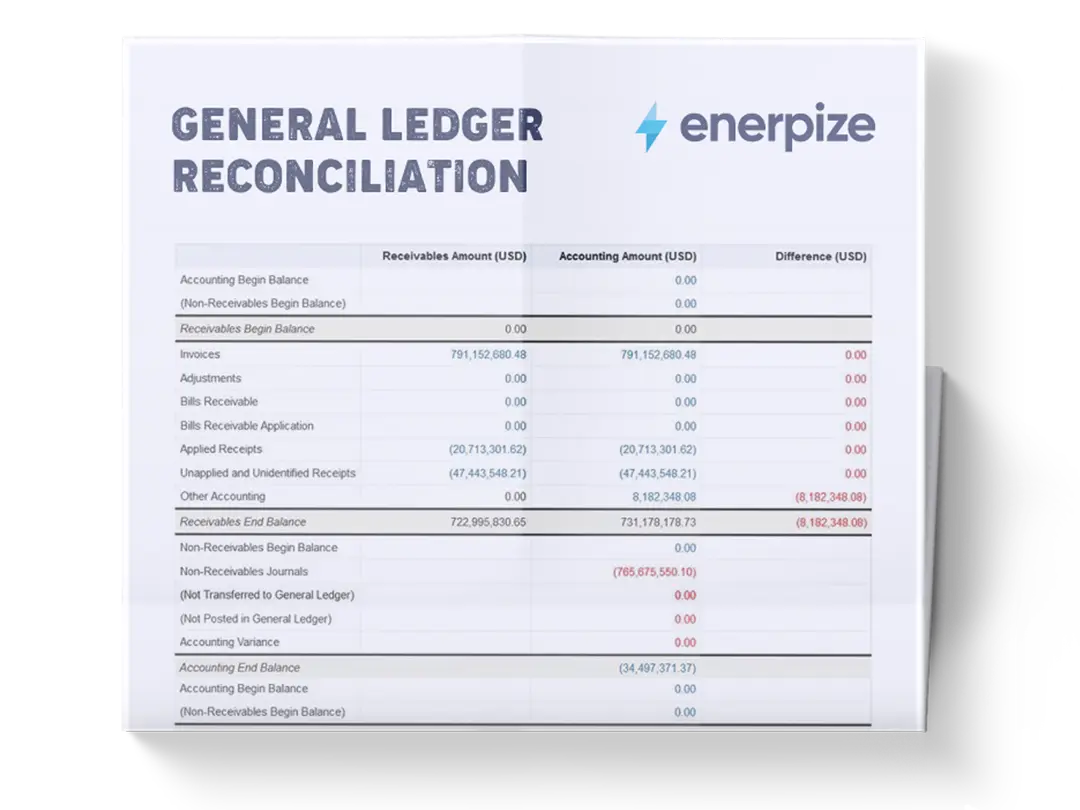
2- Balance Sheet (End of Period)
- Beginning Cash: Starting cash balance for the period.
- Accounts Receivable: Outstanding payments owed by customers.
- Inventory: Current value of stock held.
- Total Current Assets: Sum of cash, receivables, and inventory, representing short-term financial strength.
- Net Fixed Assets: Long-term assets like equipment, property, or capital investments.
- Total Assets: Overall resources owned by the business.
- Accounts Payable: Short-term obligations to suppliers.
- Short-Term Debt: Loans or borrowings due within a year.
- Total Current Liabilities: Sum of all short-term obligations.
- Long-Term Debt: Debt payable over a period longer than one year.
- Total Liabilities: Complete measure of company obligations.
- Equity: Owner’s stake or retained earnings, indicating net value.
- Total Liabilities + Equity: Ensures balance sheet accuracy, confirming assets equal liabilities plus equity.
- Balance Check: Automatic verification that total assets equal total liabilities and equity.
3- Financial Ratios
- Gross Margin: Proportion of revenue remaining after COGS, indicating production efficiency.
- Net Profit Margin: Profitability after all expenses, assessing overall financial success.
- Current Ratio: Current assets divided by current liabilities, measuring liquidity.
- Debt-to-Equity Ratio: Comparison of debt to shareholder equity, indicating financial leverage.
- Working Capital: Current assets minus current liabilities, representing short-term financial health.
- Quick Ratio: Measures liquidity excluding inventory, providing a conservative liquidity view.
- Asset Turnover: Revenue generated per dollar of assets, showing efficiency.
- Equity Ratio: Proportion of total assets financed by owners’ equity, evaluating financial stability.
4- Cash Flow Statement
- Cash Flow from Operating Activities (CFO): Cash generated by core business operations.
- Cash Flow from Investing Activities (CFI): Cash used for or generated from investments in assets.
- Cash Flow from Financing Activities (CFF): Cash movements from loans, repayments, or equity transactions.
- Net Cash Flow: Aggregate of CFO, CFI, and CFF, showing overall liquidity change.
- Ending Cash Balance: Total cash available at the period’s end.
How to Use The Financial Analysis Report Template
1- Input Budgeted Figures
Begin by entering planned revenue, expenses, and investments for the period. These will serve as benchmarks for performance comparison.
2- Record Actual Results
Populate actual revenues, costs, and cash flows as they occur. Include all financial activity to ensure comprehensive tracking.
3- Calculate Variances
The template automatically computes variances between budgeted and actual figures, highlighting over- or under-performance. Review both dollar and percentage variances.
4- Update Prior-Year Comparisons
Enter historical figures for context. The template calculates PY variances to provide trend analysis.
5- Analyze P&L Performance
Examine gross profit, EBIT, and net profit to understand operational efficiency and profitability drivers.
6- Assess Balance Sheet Health
Review assets, liabilities, and equity. Check the balance check section to confirm accounting accuracy.
7- Evaluate Financial Ratios
Use ratios to gain insight into liquidity, profitability, efficiency, and leverage. Compare ratios with industry benchmarks to assess performance.
8- Review Cash Flow Statements
Track operational, investing, and financing cash flows. Evaluate whether cash generation supports ongoing business needs.
9- Interpret Insights
Identify areas needing corrective action, such as overspending, underperforming revenue streams, or liquidity risks.
10- Prepare Reports for Stakeholders
Summarize findings with charts or tables as needed for internal or external reporting.
Stop Filling In Spreadsheets. Start Reading Insights. Enerpize automatically calculates variances, profit margins, and financial ratios so you can spend less time building reports and more time acting on them. Start for free.
Related Templates:
Quarterly Financial Report Template
Weekly Financial Report Template
Profit and Loss Statement Template
Excel Cash Flow Statement Template
Importance of Financial Analysis Report Template
Comprehensive Performance Monitoring
The template consolidates P&L, balance sheet, cash flow, and ratios in a single view to allow businesses to understand the interplay between profitability, liquidity, and solvency, rather than analyzing each statement in isolation.
Variance Identification and Analysis
Variance analysis is a central feature to highlight efficiency gaps and resource allocation issues. By reviewing variances in dollars and percentages, managers can take targeted corrective actions, such as renegotiating contracts or adjusting workforce planning.
Strategic Decision Support
The template enables data-driven decisions. For example, observing a decline in gross profit from $80,000 (budget) to $77,000 (actual) may trigger pricing adjustments or cost reductions. Similarly, rising accounts receivable may require stricter collection policies. By integrating budget, actual, and prior-year data, the template provides a strong foundation for operational and strategic planning.
Liquidity and Solvency Management
Metrics like current ratio and debt-to-equity ratio provide insight into the company’s ability to meet short- and long-term obligations. For example, a high current ratio indicates sufficient short-term liquidity, whereas a declining debt-to-equity ratio demonstrates improved financial stability. The template allows proactive planning to prevent cash shortages or over-leveraging.
Profitability Optimization
Detailed breakdowns of expenses and revenue streams allow targeted profitability improvements. By isolating cost drivers and profit contributors, businesses can focus on high-margin activities or optimize underperforming segments.
Forecasting and Planning
Historical and current data support forecasting. Using the template, a manager can analyze trends and project future cash inflows. This facilitates more accurate budgeting, scenario planning, and resource allocation decisions.
Regulatory and Audit Readiness
The financial report ensures that all financial data is documented and easy to verify. The Balance Check ensures assets equal liabilities plus equity, simplifying audit processes and ensuring compliance with accounting standards.
Who Can Use The Financial Analysis Report Template?
Small and Medium Business Owners
Provides an accessible tool for monitoring revenue, expenses, and profitability. For example, a small business owner can immediately see that net profit is below the budgeted and identify the cost categories responsible.
Finance and Accounting Professionals
Streamlines reporting and variance analysis. Accountants can calculate ratios like gross margin and working capital without manual formulas, freeing time for in-depth interpretation.
Corporate Managers and Executives
Supports strategic decision-making. For example, observing a decrease in asset turnover may prompt management to reallocate underperforming assets to more profitable divisions.
Investors and Analysts
Allows evaluation of profitability, liquidity, and solvency. An investor reviewing the template can quickly see that the current ratio is indicating strong liquidity, while net profit margins show areas for improvement.
Consultants and Advisors
Facilitates professional client reporting. Consultants can present a full picture of financial performance, identifying cost inefficiencies, cash flow gaps, or opportunities for operational improvements.
Bankers and Lenders
Helps assess creditworthiness. The detailed balance sheet and cash flow statement show whether the company can service debt or sustain additional loans.
Non-Finance Professionals
The template’s intuitive layout makes complex financial data understandable. Even without accounting expertise, users can track variances, ratios, and cash flow, gaining insight into business performance.
From Small Business Owners to CFOs, Enerpize Delivers the Numbers That Matter. Get audit-ready financial statements, live ratio tracking, and variance analysis built into your accounting software. Start for free.