Posted on 10 June 2025
Weighted Average Inventory Template Excel & Google Sheets
- The weighted average inventory template is available in Excel and Google Sheets.
- It simplifies inventory valuation using the weighted average method, balancing inputs and outputs with precision.
- Ideal for maintaining clarity in cost structure, supporting smarter procurement and pricing decisions, and enhancing financial reporting accuracy.


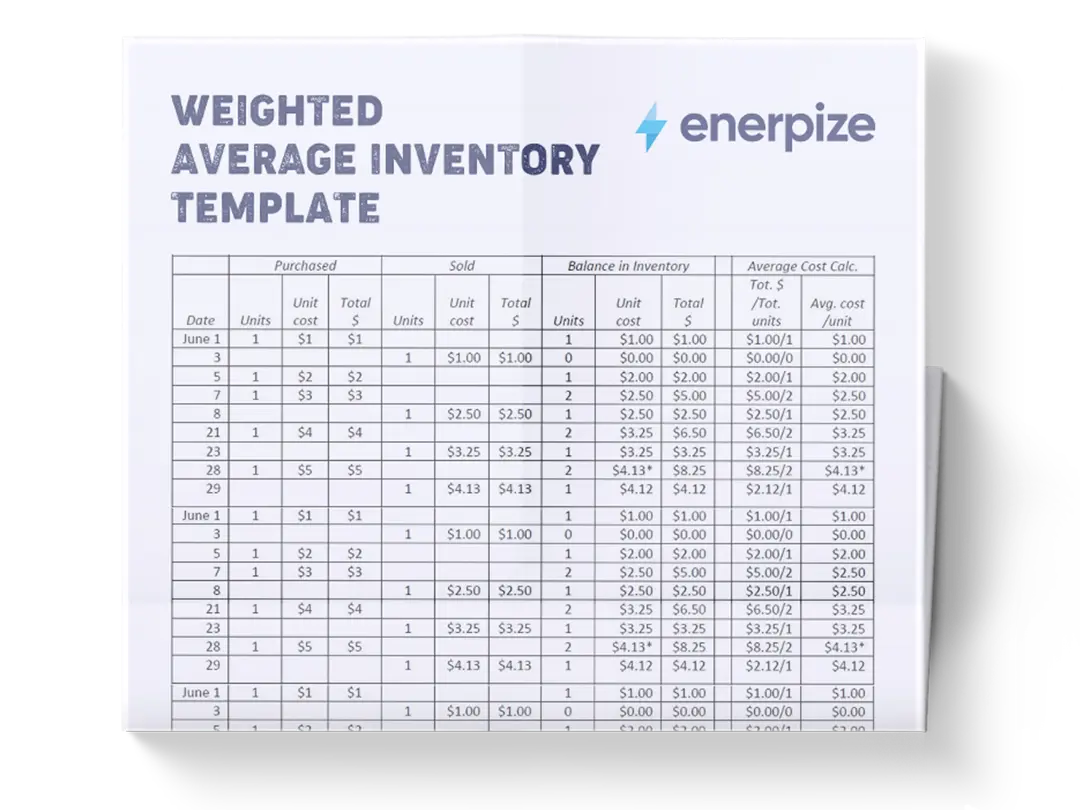
What is The Weighted Average Inventory Template?
A weighted average inventory template is designed to help businesses apply the weighted average costing method to inventory valuation. This method smooths out price fluctuations by calculating a new average unit cost after every inventory purchase, allowing businesses to assign consistent costs to outgoing goods. Using the template, you can track inventory movements—purchases and sales—on a per-transaction basis.
For each sale, it automatically calculates the cost of goods sold (COGS) using the current weighted average, ensuring that both ending inventory and COGS reflect a logical, balanced valuation.
What Does a Weighted Average Inventory Excel Template Contain?
1- Date
Tracks the transaction chronologically. This is critical for maintaining the flow of inventory records over time and identifying purchase/sales patterns.
2- Description
Records the transaction type or details—e.g., “Beginning Inventory,” “Purchase Order #152,” or “Sale to Client ABC.” Provides context for the units moved and helps with reconciling data later.
3- Units In
The quantity of inventory added to stock. Appears during purchases or returns. Each inflow updates the total inventory and contributes to recalculating the average unit cost.
4- Unit Cost In
The cost per unit of the incoming goods. Combined with “Units In,” it determines the total cost of that purchase. This figure directly influences the new average unit cost.
5- Total Cost In
The product of Units In × Unit Cost In. This amount is added to the current inventory value to calculate the updated average unit cost after the transaction.
6- Units Out
Inventory removed—due to sales, transfers, or shrinkage. This value is deducted from the current stock count and valued at the current average unit cost.
7- Unit Cost Out
Pulled directly from the running average. The cost per unit is applied to the outgoing quantity, ensuring consistent COGS calculation without batch tracking.
8- Total Cost Out
The product of Units Out × Unit Cost Out. This becomes the cost of goods sold for that transaction and is deducted from the total inventory value.
9- Balance Units
Displays the running total of inventory units on hand after the transaction. Essential for inventory tracking and forecasting restocking needs.
10- Balance Cost
Shows the total value of remaining inventory after each transaction, accounting for both inflows and outflows.
11- Avg Unit Cost
Automatically recalculates with every new entry. The formula: (Previous Inventory Value + New Purchase Cost) ÷ (Previous Units + New Units), ensures your inventory valuation stays current and accurate, without skewing from recent price swings.
Useful Tool: Average Inventory Calculator
How to Use the Cost of Weighted Average Template
1- Input Opening Inventory
Start with your beginning stock. Enter the date, a brief description (e.g., “Beginning Inventory”), number of units, and unit cost. The weighted average inventory Excel template will automatically calculate the total inventory value and average unit cost.
Pro Tip: Always input the beginning inventory before recording any purchases or sales. This establishes the baseline from which your average cost will evolve.
2- Record Purchases
Every time you restock, add a new row:
- Enter the purchase date and description.
- Fill in “Units In” and “Unit Cost In.”
The template will:- Calculate the Total Cost.
- Add this to your existing inventory value.
- Recalculate the Avg Unit Cost accordingly.
Important: Do not manually change the average cost column. Let the template do the math to avoid errors.
3- Record Sales or Outflows
For each sale or inventory deduction:
- Enter the date and description.
- Fill in “Units Out.”
The template will:- Pull the current Avg Unit Cost.
- Calculate Total Cost Out.
- Update your inventory value and balance.
4- Monitor Average Cost Shifts
With every purchase, your average cost will likely shift. Watch this column for trends, especially if your suppliers change prices frequently.
E.g., if your average cost jumps significantly, investigate the contributing purchase. Did a bulk buy at a higher price spike your valuation?
5- Validate Totals Monthly
Periodically reconcile:
- Ending “Balance Units” with physical counts.
- Ending “Balance Cost” with your general ledger.
Pro Tip: Add a monthly subtotal row if you want to segment the data for reporting purposes. This doesn’t affect calculations but improves clarity.
6- Keep a Clean Audit Trail
Be consistent with descriptions and reference numbers (e.g., PO numbers, invoice codes). This makes it easier to trace discrepancies, justify unit costs, and support internal or external audits.
Related Templates
Inventory Management Template Excel
Inventory Valuation Template Excel
Small Business Inventory Sheet Excel, Word & PDF
Importance of Weighted Average Template
Tracks Inventory Value
The WAC method simplifies inventory valuation by using a single average cost per unit, thereby eliminating the need to track multiple cost layers, as seen in the FIFO or LIFO methods. This makes it easier to calculate and monitor the current value of inventory, especially for companies with large volumes of similar items. The consistent application of the average cost reduces confusion and supports more efficient financial reporting.
Saves on Paperwork and Administration
Since all inventory units are valued at the same average cost, there’s no need to maintain detailed records of each purchase price. This significantly reduces administrative overhead and documentation requirements. For growing businesses or those with frequent inventory purchases, this efficiency translates into time savings and lower operational costs.
Saves Costs Through Efficiency
The WAC method helps reduce labor hours and potential errors associated with manual tracking. The ability to quickly compute inventory values allows for faster decision-making and improved cash flow management. Over time, these efficiencies contribute to meaningful cost reductions and better resource allocation across the business.
Depict Actual Costs Accurately
Because the weighted average considers all purchases made during a period, it offers a more balanced and realistic view of inventory costs compared to methods that rely on timing-based assumptions. This leads to more accurate profit calculations and better-informed pricing strategies, particularly when input costs vary seasonally or due to market volatility.
Less Susceptible to Price Fluctuations
The WAC method smooths out price swings by averaging costs across all available inventory. This results in more stable and predictable COGS figures, which are less likely to be distorted by short-term market changes. For strategic planning and budgeting purposes, this stability can provide a clearer picture of long-term financial health.
Adherence to Accounting Standards
Being compliant with both Generally Accepted Accounting Principles (GAAP) and International Financial Reporting Standards (IFRS), the WAC method is widely accepted and suitable for businesses operating domestically or internationally. This ensures that financial statements remain credible and audit-ready, regardless of the regulatory environment.
Who Can Use the Weighted Average Inventory Template?
E-commerce Businesses
Online retailers dealing with high-volume, fast-moving inventory benefit greatly from the WAC method. It eliminates the need to track individual purchase costs, allowing them to focus on scaling operations rather than managing complex inventory records.
Manufacturing Companies
Manufacturers often deal with raw materials and components sourced at different times and prices. The WAC method enables them to maintain a uniform cost basis across production cycles, supporting more accurate costing and profitability analysis.
Wholesale Distributors
Wholesalers who handle bulk quantities of homogeneous products find the WAC method advantageous due to its simplicity and scalability. It allows for rapid calculation of inventory values and facilitates smoother month-end closing processes.
Startups and Growing Businesses
As businesses scale, maintaining detailed inventory records becomes increasingly cumbersome. The WAC method offers a scalable solution that grows with the business, minimizing administrative overhead while maintaining compliance and accuracy.
Companies with Frequent Purchases
Organizations that make regular inventory purchases at fluctuating prices, such as importers or seasonal product sellers, benefit from the smoothing effect of the weighted average. This ensures that inventory valuations reflect a realistic average rather than being skewed by outlier transactions.
Businesses Seeking Simplified Reporting
Any company aiming to streamline its financial reporting, reduce errors, and ensure consistency in inventory valuation will find the WAC method—and its corresponding template—a practical and effective solution.