Posted on 4 December 2025
Cost Benefit Analysis Template Excel & Word
- The cost-benefit analysis template is available in Excel, Word, Google Sheets, and Google Docs.
- Breaks down all project costs from direct labor to compliance fees, across six years for accurate long-term forecasting.
- Calculates total benefits, discount factors, present values, NPV, and benefit-cost ratios to guide approval decisions.
- Ideal for project managers, finance teams, analysts, and decision-makers who need a structured, reliable method to evaluate investments.


What is The Cost Benefit Analysis Template?
A Cost Benefit Analysis (CBA) template guides you through evaluating whether a project, initiative, or investment delivers more value than it consumes. It standardizes the process of identifying every cost and benefit—direct, indirect, tangible, and intangible and converting them into monetary terms so they can be compared objectively.
By organizing this information in a clear, consistent format, the template helps decision-makers assess financial impact, strategic relevance, and overall feasibility. It ensures that assumptions are explicit, calculations are transparent, and trade-offs are easy to interpret.
Ultimately, it provides a disciplined, repeatable method for determining whether a project’s expected gains justify its total costs and whether it aligns with broader organizational priorities.
What Does The Cost-Benefit Analysis Template Contain?
1- Detailed Cost Categories
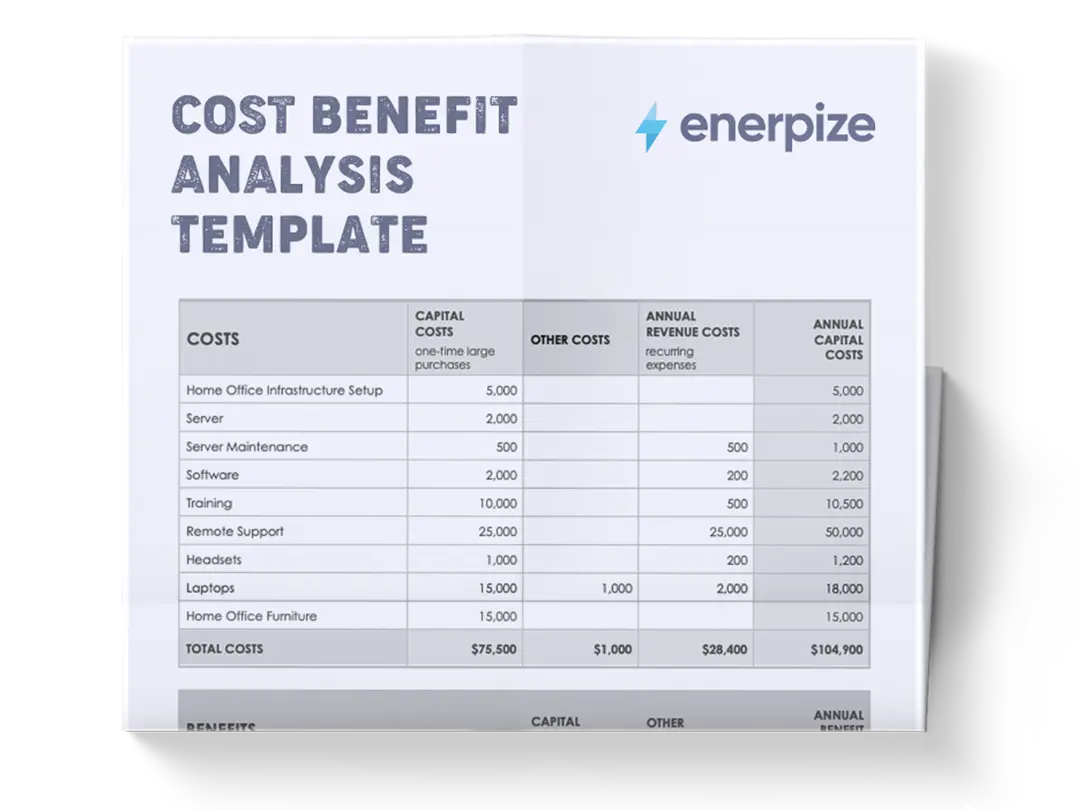
The cost-benefit analysis template organizes all expenses into five structured cost groups: Direct Costs, Indirect Costs, Recurring & Capital Costs, Compliance, and Contingency. Each category includes a six-year forecast to ensure long-term financial visibility.
Within these sections, you’ll find itemized entries like labor, materials, rent, utilities, equipment, software subscriptions, and regulatory fees—giving you a granular view of where budget resources are allocated. This structure helps you evaluate both operational and one-time costs with precision.
2- Year-by-Year Cost Totals
Every section includes annual totals plus an overall cumulative total. This makes it easy to spot cost spikes, understand cost curves over time, and compare categories such as capital investment vs. recurring operational spend. It also simplifies budget justification and financial storytelling—key when presenting to leadership or stakeholders.
3- Revenue and Quantitative Benefit Breakdown
The benefits section captures projected revenue, new sales, and the overall total value generated by the initiative over six years. It’s structured to mirror the cost table, enabling straightforward comparisons. These quantified benefits form the foundation for all later calculations, including NPV, BCR, and payback period.
4- Discount Factor (7%)
A predefined 7% discount factor is applied across all years to account for the time value of money. This ensures that future costs and benefits are weighted accurately—critical for realistic financial assessment. The discount factor percentages are already provided, allowing the model to immediately generate discounted present values without manual calculation.
5- Present Value of Costs and Benefits
Using the discount factor, the template automatically calculates the PV Costs and PV Benefits for each year. This comparison reveals the real financial impact of your project when adjusted for inflation and opportunity cost. The result is a more credible projection grounded in financial best practices.
6- Net Present Value (NPV)
The NPV calculation provides a single, decisive figure reflecting the net financial gain of the initiative. In the template, the total PV Benefits and total PV Costs are already computed, allowing you to instantly evaluate whether your project creates value or drains resources over its lifecycle.
7- Benefit-Cost Ratio (BCR)
The cost benefit analysis template includes a ready-made BCR calculation that compares total discounted benefits to total discounted costs. This metric is particularly important for organizations that evaluate projects based on efficiency rather than raw profitability. A BCR greater than 1 indicates the benefits outweigh the costs—your template makes this judgment call straightforward.
8- Built-In Contingency Buffer
A 10% contingency is included to help account for uncertainty, scope adjustments, or unexpected cost overages. This buffer protects your assessment from unrealistic optimism and ensures your financial forecast stays resilient even under variable conditions.
How to Use The Cost Benefit Analysis Template
1- Define the Scope of Your Initiative
Start by clearly identifying the project, program, or investment you're evaluating. This includes understanding its timeline, the resources it will require, and the outcomes it aims to produce. Clarity at this stage ensures that the data you enter later is grounded in real operational needs rather than guesswork.
Be specific: Does the initiative require new hires? Does it depend on external vendors? Is revenue expected immediately or gradually? Answering these questions upfront removes ambiguity from the analysis.
2- Enter Your Cost Data by Category
Work through each cost category—Direct, Indirect, Recurring & Capital, Compliance, and Contingency—and input the figures relevant to your project.
- Direct Costs (like labor and materials) typically tie directly to project execution.
- Indirect Costs (rent, utilities) capture operational support overhead.
- Capital Costs (equipment, technology, infrastructure) account for long-term investments.
- Compliance covers licensing, certification, audits, or regulatory fees.
- Contingency is calculated automatically, but ensure your base costs accurately reflect potential variability.
3- Populate the Benefits Section
Input annual expected benefits such as increased revenue, operational savings, or new sales generated by the initiative. These numbers should align with your organization's revenue models or sales forecasts. The template is structured to combine these entries automatically into total annual benefits.
Ensure your benefit projections are realistic and supported by data—overstating them can make the entire analysis unreliable.
4- Apply the Discount Factor to Forecasts
The template already includes a 7% annual discount rate, which is standard for most business environments. As you enter benefits and costs, the discount factor adjusts future amounts to their present value. This calculation reflects the principle that money today is more valuable than the same amount in the future. By using the built-in discounting, you produce a more credible financial evaluation and maintain alignment with industry standards for long-term investment analysis.
5- Review PV Costs and PV Benefits
After entering your data, examine the present value tables. This is where the true financial picture emerges. A project that looks profitable in raw numbers may shrink considerably once discounted. Look for patterns:
- Do costs decrease or increase over time?
- Are benefits front-loaded or delayed?
- Is the project’s financial strength driven by early or late gains?
6- Interpret NPV and BCR to Support Decisions
The NPV and BCR calculations are the decisive outputs of the Cost Benefit Analysis template.
A positive NPV indicates that the project is projected to generate value after accounting for the time value of money.
A BCR greater than 1 means the benefits outweigh the costs, making the project financially efficient.
Related Template
Importance of the Cost Benefit Analysis Template
Provides a structured, evidence-based decision process
A CBA template forces decisions to be grounded in real data rather than instinct or internal politics. By organizing costs and benefits side-by-side, it eliminates guesswork and highlights the true economic implications of each option. This structure helps leaders justify tough decisions and avoid cognitive biases—especially in high-stakes environments where subjective opinions can derail rational planning.
Improves accuracy and consistency across evaluations
Without the cost benefit analysis template, teams often overlook hidden costs or undervalue intangible benefits. A standardized framework minimizes these gaps by prompting analysts to consider every relevant factor, from operational expenses to long-term strategic value. This consistency leads to cleaner comparisons between competing projects and reduces the risk of errors in judgment or calculation.
Enhances resource allocation and project prioritization
Organizations rarely have unlimited resources. A CBA template helps identify which initiatives deliver the highest return on investment and which drain resources without adequate payoff. By quantifying outcomes and opportunity costs, it clarifies which projects deserve priority and which should be reconsidered or abandoned.
Improves communication and stakeholder alignment
The template presents complex information in an organized, digestible format that stakeholders can follow at a glance. This transparency helps build trust, reduces misunderstandings, and creates a common language for discussing financial trade-offs. It also streamlines meetings by giving everyone the same reference point.
Supports strategic planning and long-term decision-making
Beyond immediate financial outcomes, the template helps assess how a project aligns with long-term strategic goals. It prompts teams to evaluate both short-term gains and future implications, strengthening the organization’s ability to plan with foresight and accountability.
Who Can Use The Cost Benefit Analysis Template?
Business leaders and project managers
Executives, managers, and PMs use CBA templates to evaluate whether new initiatives—such as hiring, product development, or technology upgrades—make financial and strategic sense. The CBA template helps them justify decisions to senior leadership, mitigate risks, and ensure resources are deployed where they deliver the highest value.
Public-sector and policy professionals
Government agencies and nonprofit organizations rely on CBA templates to assess public programs, regulations, and infrastructure projects. With taxpayer money and public trust on the line, a transparent, data-driven framework helps demonstrate accountability and ensures policies benefit the communities they’re meant to serve.
Financial analysts and strategic planners
Analysts use CBA templates to assess return estimates, model scenarios, forecast risks, and support long-term strategic planning. The structured format allows them to translate complex financial reality into clear recommendations for stakeholders who may not be financially trained.
Healthcare, environmental, and social-impact teams
Industries dealing with intangible outcomes—health improvements, environmental gains, or social value—use CBA templates to monetize impacts that are easy to overlook. This helps organizations compare interventions fairly and defend decisions with rigorous economic justification.
Small business owners and entrepreneurs
For smaller organizations without complex finance teams, the template serves as a practical decision tool. It helps them determine whether new investments, expansions, or operational changes are worth the cost, supporting smarter growth and minimizing financial missteps.