Posted on 22 October 2025
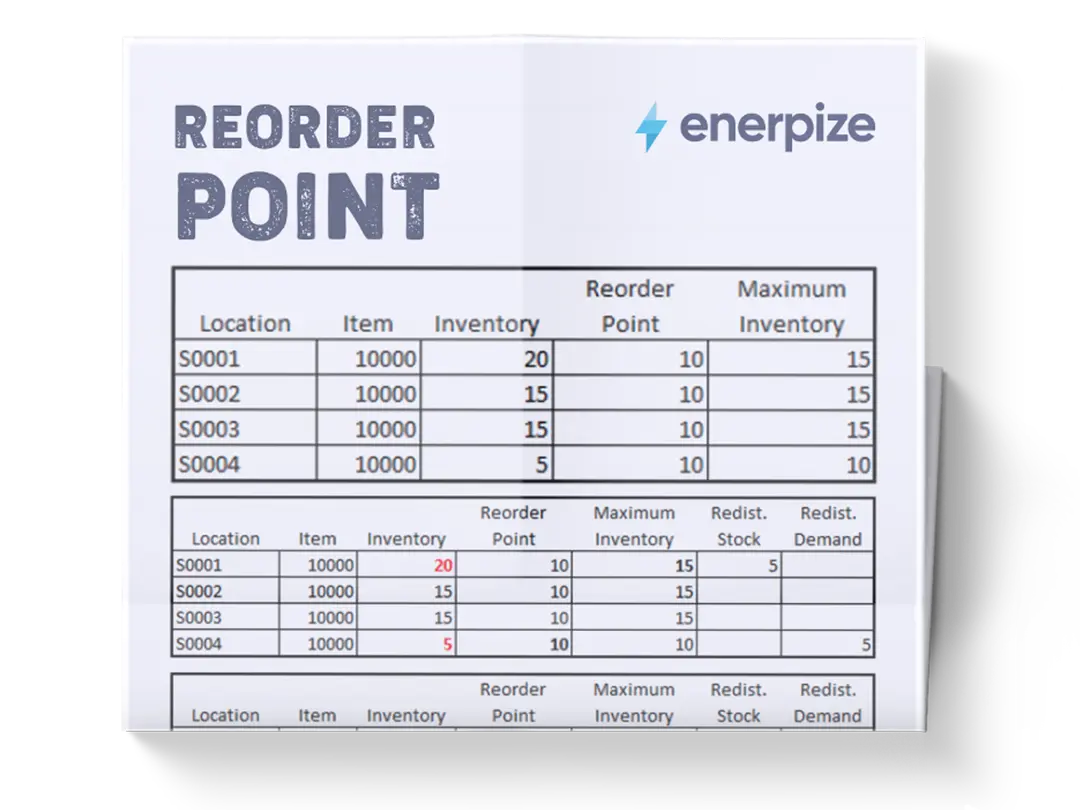
Reorder Point Template Excel & Google Sheets
- The reorder point template is available in Excel & Google Sheets.
- Tracks daily usage, lead time, and safety stock to determine the right reorder point for every product.
- Used for inventory control, supply chain planning, and ensuring uninterrupted operations.
- Perfect for inventory managers, warehouse supervisors, and small business owners who need a simple yet reliable way to stay in stock without overordering.


What is The Reorder Point Excel Template?
The Reorder Point Excel Template is a practical inventory management tool designed to help businesses determine when they should restock their products to prevent stockouts and maintain consistent operations. It calculates the inventory level at which a new order must be placed, known as the Reorder Point (ROP), based on critical variables such as average demand, supplier lead time, and safety stock.
By using the reorder point template, businesses can anticipate when inventory will run low and trigger replenishment before reaching a critical shortage. This ensures customers receive their orders on time while minimizing excess stock that ties up working capital. The template brings data-driven precision to what is often a guessing game, providing a structured, repeatable process that optimizes both inventory flow and cash efficiency.
Recommended for you: Online Reorder Point Calculator
What Does The Reorder Point Excel Template Contain?
Item Name
Each row begins with a list of your products or SKUs. This column serves as your reference point for tracking reorder levels across different items. Using clear, consistent naming (e.g., “Product A – 500ml,” “Product B – 2L”) helps avoid confusion and ensures accurate updates when inventory levels change.
Daily Usage (Units)
This column records the average number of units sold or used per day. It’s the foundation of your reorder point calculation. The more precise your daily usage data, the more accurate your reorder levels will be. To get reliable numbers, calculate daily usage over at least one month of sales or consumption data to smooth out fluctuations caused by seasonal or random demand spikes.
Lead Time (Days)
Lead time refers to how long it takes for an order to arrive once it’s placed. Inaccurate lead time is one of the most common causes of stockouts, so record this figure carefully—consider both supplier reliability and shipping time. For example, if your supplier typically delivers in 5 days but sometimes takes up to 7, base your calculation on the higher figure to add a margin of safety.
Safety Stock (Units)
Safety stock acts as your emergency buffer. It protects you against sudden demand surges or delivery delays. The Excel reorder point template includes a dedicated column for this, allowing you to manually adjust safety stock based on item importance or demand variability. For high-demand or critical items, keep more safety stock; for low-priority or predictable items, you can reduce it to free up capital.
Reorder Point (Units)
This is the calculated threshold that signals when it’s time to reorder. Once your current stock falls to or below this number, it’s your cue to place a new order. This column is the heart of the ROP template; it combines your input data to provide an automatic, data-driven reorder signal.
Current Stock (Units)
This field tracks how much of each item you currently have on hand. Update it regularly (daily or weekly) to ensure the calculations stay relevant. The more frequently this data is refreshed, the more reliable your reorder alerts will be.
Need to Reorder
This column automatically flags whether an item requires replenishment based on its current stock versus the reorder point. A simple “Yes” or “No” output gives you a quick visual summary, letting you identify which products are approaching critical levels.
How to Use The Reorder Point Excel Template
1- Enter Your Product List
Start by filling in your product names in the “Item Name” column. Use specific identifiers—such as SKU codes or item categories—to make sorting and filtering easier later. If you manage a large catalog, consider grouping similar items (e.g., “Cleaning Supplies,” “Office Equipment”) for better organization.
2- Input Your Daily Usage
Record the average daily consumption or sales volume for each product. Use historical data for accuracy, and update it regularly if your sales trends change. This ensures your reorder points evolve with your business activity.
3- Define Your Lead Time
Enter the number of days between placing an order and receiving the goods. Be realistic—don’t rely solely on supplier promises. Use actual delivery data or average lead times over several months to avoid underestimating delays.
4- Set Your Safety Stock Levels
In the “Safety Stock” column, input the buffer quantity you want to keep on hand. While a basic rule is to keep at least one extra lead time’s worth of stock, advanced users can calculate it using demand variability and supplier performance data.
5- Check the Calculated Reorder Point
Once you enter your data, the reorder point template automatically calculates the reorder point using the formula provided. Review these numbers and adjust safety stock or lead time inputs if the results seem unrealistic. For instance, if your reorder point exceeds your storage capacity, you may need to negotiate shorter lead times or reduce order frequency.
6- Update Current Stock Regularly
The “Current Stock” field should reflect real-time inventory. Update it daily or weekly based on your tracking system. This ensures the “Need to Reorder” indicator stays accurate. Consider linking this field to your POS or ERP system if you manage inventory digitally.
7- Monitor Reorder Alerts
Finally, review the “Need to Reorder” column. When it displays “Yes,” it’s time to place a new order. You can use conditional formatting in Excel to highlight these cells in red or yellow for instant visibility.
Related Templates
Small Business Inventory Spreadsheet
Stock Management Excel Template
Spare Parts Inventory Management Excel Template
Importance of Reorder Point Excel Template
Prevents Stockouts
A well-calculated reorder point ensures you never run out of key inventory items. When inventory levels drop to the defined threshold, the reorder point template Excel signals that it’s time to reorder—well before a stockout occurs. This proactive approach prevents lost sales, dissatisfied customers, and operational disruptions. In industries where availability is a competitive differentiator, maintaining this continuity directly strengthens brand reputation and customer loyalty.
Reduces Overstocking
Excess inventory ties up valuable capital and increases carrying costs such as storage, insurance, and potential depreciation. The reorder point template helps strike the right balance by triggering orders only when necessary. This minimizes waste, reduces the risk of obsolescence, and ensures a leaner, more cost-efficient inventory operation that frees cash for higher-return investments.
Improves Cash Flow
When inventory is aligned with actual demand and lead times, your business can avoid both emergency orders and idle stock. The reorder point Excel template facilitates just-in-time purchasing—keeping liquidity high and unnecessary expenses low. The result is healthier cash flow management, allowing resources to be reallocated to other strategic areas like marketing, product innovation, or expansion.
Enhances Forecast Accuracy
By recording sales trends and lead-time patterns over time, the template creates a feedback loop that sharpens future forecasts. Businesses gain visibility into seasonality, demand spikes, and supplier reliability—allowing more accurate reorder points and smoother supply chain planning. Over time, this precision minimizes human error and guesswork in decision-making.
Optimizes Supply Chain Efficiency
The reorder point template integrates seamlessly with supplier lead-time data, enabling businesses to evaluate supplier performance objectively. With reliable reorder data, you can identify delays, negotiate better terms, and ensure that procurement aligns with real operational needs. This transforms reordering from a reactive task into a controlled, strategic process.
Who Can Use The Reorder Point Excel Template?
Small and Medium-Sized Businesses (SMBs)
SMBs often operate without advanced inventory management software, making this Excel-based solution ideal. It provides the analytical precision of a larger ERP system in a simple, accessible format. Owners and managers can use it to monitor inventory levels across multiple SKUs, calculate reorder points accurately, and maintain consistent product availability without overcomplicating their processes.
E-commerce and Retail Stores
Online and brick-and-mortar retailers can benefit immensely from using the ROP template to balance fast-moving inventory with seasonal demand shifts. It helps them avoid the two major pitfalls of retail—overselling (due to stockouts) and overstocking (due to misjudged demand). With automated reorder point tracking, retailers can keep their fulfillment promises while reducing unnecessary warehousing costs.
Manufacturers and Production Teams
For manufacturers, the Excel reorder point template ensures a steady supply of raw materials and components. It links directly to bills of materials (BOM) and production schedules, preventing costly downtime caused by material shortages. By maintaining ideal input levels, production runs remain consistent and uninterrupted—even during supplier delays or sudden demand increases.
Procurement and Supply Chain Managers
Professionals managing procurement or supply chain operations can use the reorder point template Google Sheest as a data-driven decision aid. It provides visibility across multiple suppliers, lead times, and demand fluctuations, supporting strategic ordering decisions. It’s particularly useful for organizations that want to streamline ordering without investing in complex inventory systems.
Warehouse and Operations Teams
The reorder point template serves as a straightforward operational control tool for warehouse managers. It simplifies stock monitoring by signaling when to reorder based on actual movement rather than estimates. This visibility prevents stockouts and excess accumulation—helping operations run smoothly and predictably, even during high-demand periods.