Posted on 22 October 2025
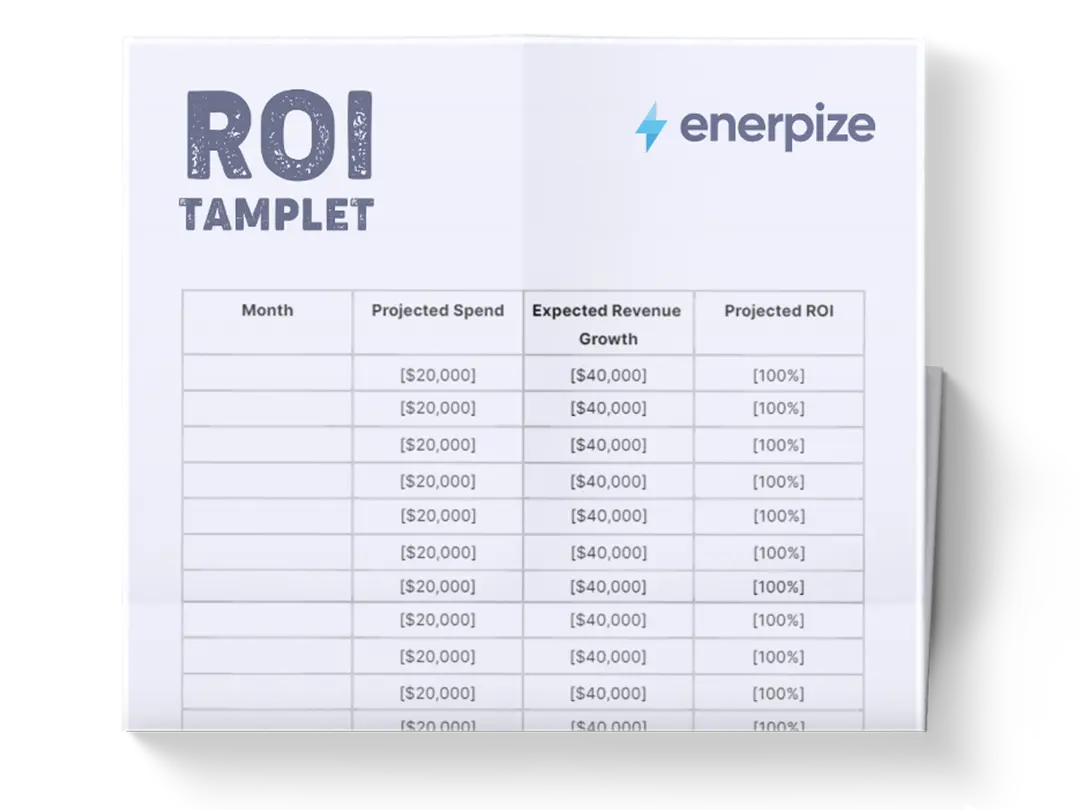
ROI Template Excel & Google Sheets
- The ROI template is available in Excel & Google Sheets.
- Tracks financial performance across projects and investments to evaluate profitability and efficiency.
- Calculates multiple ROI metrics—net income, capital gain, total return, and annualized ROI—for precise analysis.
- Ideal for business owners, financial analysts, and project managers seeking data-backed investment decisions.


What is the ROI Template?
The Return on Investment (ROI) template is a structured tool designed to measure the profitability and efficiency of an investment relative to its cost. It calculates the financial return generated from a project, product, or initiative, allowing you to quantify exactly how much value you’re getting for every dollar spent. ROI is typically expressed as a percentage using the formula: ROI = (Net Profit ÷ Cost of Investment) × 100.
This simple yet powerful metric helps businesses and investors evaluate the performance of investments.
By using a standardized ROI template, decision-makers can easily compare multiple investments, monitor performance over time, and communicate results clearly to stakeholders. In short, it’s a practical financial lens for distinguishing profitable decisions from costly missteps.
Recommended for you: Online ROI Calculator
What Does the ROI Template Contain?
Business Details
This section captures the basic identifiers of the investment or project. Including precise dates helps calculate time-based metrics such as annualized ROI and ensures accurate comparison between different periods.
Original Investment Value
This figure serves as the foundation for all ROI calculations. Entering the accurate original value ensures the resulting ROI percentages reflect real profitability rather than inflated or understated results.
Net Income
The Excel ROI template uses this value to determine Net Income ROI, showing how much profit was generated relative to the amount invested. It’s one of the most straightforward indicators of financial efficiency.
Original Share Price / Current Sale Share Price
Even if your business doesn’t trade shares, this metric can represent unit-based investments—like per-customer cost in marketing or per-unit cost in production. It allows you to measure growth in value over time.
Total Dividends or Returns
Captures any additional gains distributed throughout the investment period.
Dividends, bonuses, or incremental profits should be logged here. This field ensures your Total Return ROI accounts for both income and growth-based gains.
Net Income ROI
Calculates profitability based purely on income generated from operations or project performance.
This metric isolates the return produced by the business activity itself, providing a focused view of efficiency, excluding appreciation or resale value.
Capital Gain ROI
Measures the percentage increase in asset value between purchase and sale.
For businesses, this might represent an increase in equipment resale value, property appreciation, or residual project value after completion. It highlights how well assets retain or increase their worth over time.
Total Return ROI
Combines both income and capital gain to provide a complete measure of overall profitability.
This is the ultimate snapshot of your project’s total financial return, giving you the most accurate measure of overall success.
Annualized ROI
Expresses your return as an annual rate to compare investments of different durations.
This allows apples-to-apples comparison between short-term and long-term initiatives. A project with 30% total ROI over three years, for example, might have a 9–10% annualized ROI—making it easier to benchmark against other efforts.
How to Use the ROI Template
1- Enter Basic Business and Project Information
Begin by filling in the Business Name, Investment Name, and relevant dates. Consistent date entry ensures time-sensitive calculations—like annualized ROI—are accurate. Be sure to clearly name each investment so records remain organized and traceable.
2- Input the Original Investment Value
Record the full cost of the investment, including all associated expenses such as labor, materials, marketing spend, or administrative costs. Being overly conservative here can distort your ROI percentage—accuracy is crucial.
3- Add Profit and Income Data
Insert the Net Income figure, which should reflect the true profit after deducting operational expenses. If your investment produced multiple income streams (e.g., recurring revenue, savings, or secondary gains), aggregate them for a complete view.
4- Include Asset Sale or End Value
If your project or investment resulted in an asset sale, fill in the Current Sale Value or Sale Share Price. This determines your Capital Gain ROI, revealing how much value the investment has accumulated over time.
5- Record Dividends or Distributed Returns
If you received periodic returns or distributions during the project’s life, add them under Total Dividends. This ensures your Total Return ROI captures both ongoing and final profits.
6- Review the Automatically Calculated ROI Metrics
The sheet instantly calculates your Net Income ROI, Capital Gain ROI, Total Return ROI, and Annualized ROI. Review each to understand different dimensions of performance. For example:
- A high Net Income ROI but low Capital Gain ROI may suggest operational success but weak long-term value growth.
- Conversely, a high Capital Gain ROI with minimal income could indicate an asset that appreciates but yields little cash flow.
7- Interpret Results and Take Action
Use the insights to guide future investments. A project delivering a Total ROI above your business’s cost of capital is typically profitable. Compare outcomes across projects to identify your strongest opportunities.
Related Templates
Importance of the ROI Template
Measuring Investment Efficiency
The ROI analysis template in Excel provides a clear, quantifiable way to assess how efficiently capital is being used. By comparing the returns generated to the initial investment, organizations can pinpoint which initiatives deliver the most value. This helps eliminate guesswork and promotes data-driven decision-making, ensuring that resources are directed toward the most profitable opportunities.
Supporting Strategic Decision-Making
ROI data is indispensable when determining which projects to prioritize or discontinue. With concrete numbers on performance, leadership can confidently decide whether to reinvest, expand, or pivot. It removes emotional bias from financial decisions and allows companies to base strategy on actual financial outcomes rather than perceptions or assumptions.
Assessing Financial Performance
Regularly calculating ROI helps track how investments contribute to overall business growth. It reveals which areas generate sustainable profits and which may be draining resources. This ongoing analysis supports long-term planning and helps align investment strategy with broader financial goals.
Enhancing Transparency and Accountability
A structured ROI template provides a standardized way to communicate financial outcomes to stakeholders. Whether it’s a management team, investors, or clients, presenting ROI data fosters transparency and credibility. It demonstrates that decisions are made based on measurable performance, not vague projections.
Simplifying Complex Financial Analysis
One of ROI’s biggest advantages is its simplicity. It doesn’t require specialized financial expertise to compute or interpret. That’s why the ROI template is widely used across industries—it translates complex financial information into an easily digestible metric that anyone can understand and act upon.
Who Can Use the ROI Template?
Business Owners and Entrepreneurs
For small business owners or startup founders, the ROI Excel template is an essential decision-making tool. It helps assess whether marketing campaigns, new hires, or product launches are financially viable. By quantifying returns, entrepreneurs can make smarter investments that support steady growth rather than reactive spending.
Finance and Operations Teams
Financial analysts and operations managers use an ROI template Excel to evaluate capital projects, asset purchases, and departmental budgets. It enables them to identify cost-saving opportunities, justify expenditures, and track how operational decisions impact profitability over time.
Marketing Professionals
Marketers often rely on ROI calculations to prove the impact of campaigns and justify budgets. Whether measuring ad spend efficiency, lead generation, or customer acquisition costs, the ROI template turns abstract marketing results into concrete financial outcomes—making it easier to secure stakeholder buy-in.
Investors and Analysts
For investors, ROI is a core metric for evaluating portfolio performance. It allows them to compare the profitability of different assets, funds, or ventures and allocate capital accordingly. The Excel ROI template provides consistency in how returns are measured, ensuring that every investment is assessed on the same basis.
Project Managers and Product Teams
Product and project leaders can use ROI templates to assess the financial justification of their initiatives. From developing new features to launching services, calculating ROI helps them demonstrate business impact and defend data-driven decisions in cross-functional discussions.