Posted on 5 February 2026
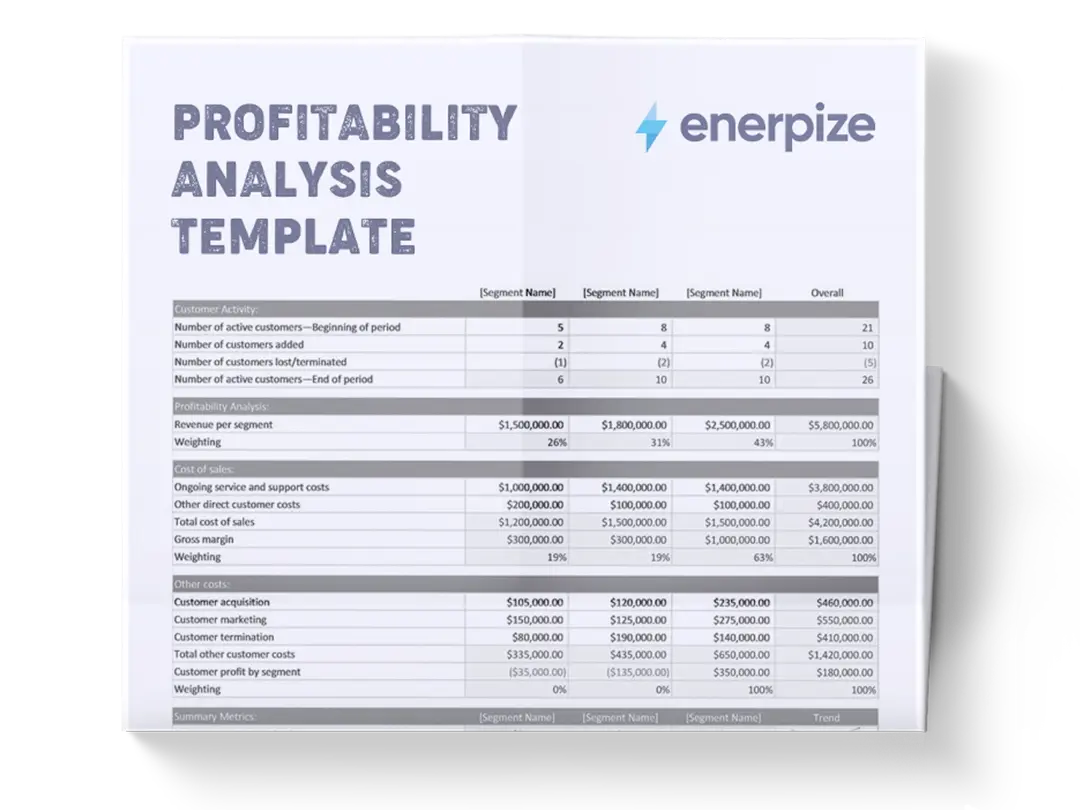
Profitability Analysis Template Excel & Google Sheets
- The profitability analysis template is available in Excel and Google Sheets.
- It compares revenue, COGS, and expenses across periods to uncover profit trends.
- Calculate gross margin, net margin, and break-even revenue in one structured view.
- Identify cost inefficiencies and revenue growth opportunities using real financial data.


What Is a Profitability Analysis Template?
A profitability analysis template consolidates revenue, cost of goods sold (COGS), operating expenses (OPEX), and key performance metrics into a single, comparative view across reporting periods. It enables businesses to move beyond surface-level income statements by clearly showing where profit is generated, where it is lost, and how financial performance is changing over time.
Rather than reviewing isolated numbers, the template connects revenue sources to their associated costs and translates them into meaningful margins and profit indicators. This makes it especially useful for operational decision-making, budgeting, and performance reviews. For small and mid-sized businesses, it provides a disciplined framework for profitability tracking without the complexity of advanced financial systems.
What Does the Profitability Analysis Template Contain?
Revenue Breakdown
Captures total income by product or service category for both the current and prior periods. This section enables period-over-period revenue comparison and highlights which offerings contribute most to overall revenue.
Product/Service
Lists each revenue-generating category separately. This structure allows revenue performance to be analyzed at a granular level rather than as a single total figure.
Current Period
Records revenue generated in the most recent reporting period. These values represent the baseline for current performance analysis.
Prior Period
Records revenue from the previous reporting period. This column enables direct comparison to assess growth or decline.
Total Revenue
Summarizes all product and service revenue for each period. This figure feeds directly into profitability calculations in the summary section.
COGS Details
Breaks down all direct costs associated with producing or delivering products and services. This section isolates variable costs that directly impact gross profit.
Total COGS
Aggregates all direct costs for each period, forming the basis for gross profit calculation.
Operating Expenses (OPEX)
Lists indirect business expenses required to operate the company, but not tied to specific products or services.
Summary & Key Metrics
Provides a consolidated financial overview derived from revenue, COGS, and OPEX data.
Gross Profit
Calculated as total revenue minus total COGS.
Gross Margin %
Shows gross profit as a percentage of revenue.
Net Profit
Calculated after subtracting operating expenses from gross profit.
Net Profit Margin %
Expresses net profit as a percentage of total revenue.
Break-Even Revenue
Indicates the revenue level required to cover all costs.
How to Use the Profitability Analysis Template
1- Start with Revenue Entry
Begin by populating the Revenue Breakdown section. Enter each product or service on its own row and record revenue for both the current and prior periods. Ensure consistency in naming across periods to preserve accurate comparisons.
2- Verify Total Revenue Figures
Confirm that the Total Revenue row accurately reflects the sum of all listed revenue streams. This total will directly impact every profitability metric downstream.
3- Input Direct Costs in The COGS Section
Enter values for Direct Materials, Direct Labor, Shipping/Packaging, and Other Direct Costs for both periods. These should include only costs that scale directly with production or service delivery.
4- Review Total COGS Calculations
Check that Total COGS correctly aggregates all direct cost categories. Errors here will distort gross profit and margin analysis.
5- Record Operating Expenses Systematically
Populate each OPEX category using actual expense data for both periods. Avoid mixing direct and indirect costs to preserve analytical accuracy.
6- Confirm Total Operating Expenses
Ensure the Total OPEX row reflects the full sum of listed operating expenses for each period.
7- Analyze Summary Metrics
Review the Summary & Key Metrics section to evaluate gross profit, net profit, margins, and break-even revenue. Use the % Change column to identify improving or declining performance areas.
8- Interpret Results Holistically
Compare changes in revenue, costs, and margins together. Profitability shifts are often driven by cost structure changes rather than revenue alone.
Importance of a Profitability Analysis Template
Reveals the true drivers of business profitability
Many businesses track revenue growth without understanding whether that growth translates into actual profit. This template connects revenue directly to COGS and operating expenses, exposing which products, services, or cost categories are driving or eroding profitability. By comparing periods side by side, decision-makers can see whether profit changes are caused by pricing, cost inflation, or expense control. This clarity supports smarter strategic decisions around product focus and resource allocation. Without this level of visibility, businesses often scale revenue while unknowingly compressing margins.
Improves cost control and expense accountability
By separating direct costs from operating expenses, the template highlights where money is being spent and how those costs evolve over time. Increases in COGS or OPEX become immediately visible through both absolute values and percentage changes. This makes it easier to identify inefficiencies, renegotiate supplier contracts, or adjust staffing levels before costs spiral out of control. Teams gain accountability because expense categories are clearly defined and consistently tracked. Over time, this discipline leads to healthier margins and more predictable financial outcomes.
Supports data-driven pricing and margin decisions
Understanding gross margin trends is essential for a pricing strategy. The template allows businesses to see whether margin compression is caused by rising costs or underpricing. This insight supports informed pricing adjustments rather than reactive decisions based on intuition. Businesses can evaluate whether to raise prices, reduce costs, or discontinue low-margin offerings. As a result, profitability decisions are grounded in financial reality rather than assumptions.
Strengthens financial planning and sustainability
The inclusion of break-even revenue and net profit metrics provides a practical foundation for financial planning. Businesses can assess how close they are to covering fixed costs and how much buffer exists during revenue fluctuations. This is particularly valuable for SMEs managing cash flow risk. By reviewing profitability trends consistently, leadership can plan growth, investment, and hiring decisions with greater confidence and reduced financial exposure.
Who Can Use a Profitability Analysis Template?
Small and Medium Business Owners
SME owners often oversee operations, sales, and finance simultaneously. This template gives them a clear, structured view of financial performance without requiring advanced accounting systems. It helps owners understand whether growth is profitable, which costs need attention, and how sustainable current margins are. With period comparisons built in, owners can spot negative trends early and act before profitability declines. It becomes a practical financial control tool rather than just a reporting document.
Finance and Accounting Teams
For finance professionals, the template serves as a standardized profitability reporting framework. It simplifies period-over-period analysis and ensures consistent categorization of revenue and costs. This structure supports internal reporting, management reviews, and budget tracking. It also reduces reliance on ad-hoc spreadsheets, improving accuracy and repeatability. Finance teams can use it as a foundation for deeper financial analysis or forecasting.
Operations Managers and Department Heads
Operational leaders benefit from understanding how their cost decisions affect overall profitability. This template translates operational spending into financial outcomes that are easy to interpret. Managers can see the impact of labor, logistics, or marketing costs in relation to revenue performance. This visibility encourages more responsible spending and alignment with profitability goals. It bridges the gap between operational activity and financial results.
Startups and Growing Businesses
Early-stage and scaling businesses often experience rapid cost changes that outpace revenue growth. This template helps founders and leadership teams monitor whether scaling efforts are improving or hurting profitability. By tracking margins and break-even points, startups can make informed decisions about expansion timing, hiring, and investment. It provides financial discipline during growth phases when cash flow risk is highest.
Looking for Beyond Just Profit Tracking in a Spreadsheet?
While this profitability analysis template helps you understand revenue, costs, and margins, growing businesses often need deeper visibility and automation. That’s where Enerpize, our all-in-one ERP platform, comes in.
With Enerpize online accounting software, you can:
- Track profitability across products, departments, and periods in real time.
- Automate financial reporting and eliminate manual spreadsheet updates.
- Connect profitability insights with sales, inventory, and operations data.
If you’re ready to move beyond spreadsheets, Enerpize brings enterprise-grade financial control to growing teams.